
 App Store
 Profile
 Security
 Sign Out
 Feeds
Feeds
 Articles
Inside a Polymarket Bot: How Mechanical Hedging Locks in Risk-Free Profit
Inside the Mind of a Polymarket BOT
If you have ever opened a Bitcoin 15-minute market on Polymarket and wondered why one trader always seems to walk away with a win, this is the deep dive you’ve been waiting for.
Most retail traders gamble on direction. Some pray for green candles. Others panic and exit on red.
But one trader, known as gabagool, consistently squeezes profit out of these tiny windows… even when he has zero idea where price is going next.
This is not luck. This is not magic. It is pure mechanical trading, powered by math that you can understand and apply yourself.
The Strategy: Turning Price Movement Into a Guaranteed Payout
Gabagool never predicts whether Bitcoin will go up or down. He simply waits for cheap opportunities on either side of the binary market.
He buys:
YES when YES becomes unusually cheap.
NO when NO becomes unusually cheap.
He doesn’t buy them together. He buys them asymmetrically, at different timestamps, when the market temporarily misprices one side.
His entire objective is to reach this simple condition: Keep the average cost of YES + the average cost of NO < $1.00
Once this happens, he has mathematically locked in profit.
The Math Behind the Magic
To understand it fully, here are the formulas his bot constantly monitors.
First, he calculates the average price paid per share:
avg_YES = Total Cost (YES) / Total Shares (YES) avg_NO = Total Cost (NO) / Total Shares (NO)
The crucial metric is the Pair Cost:
Pair Cost = avg_YES + avg_NO
As long as Pair Cost < 1.00, he guarantees profit at settlement. No matter who wins.
YES resolves: Payout = Quantity of YES shares
NO resolves: Payout = Quantity of NO shares
His risk-free profit calculation is:
Profit = min(Qty_YES, Qty_NO) — (Cost_YES + Cost_NO)
This is the heart of the strategy. Once you understand this math, anyone can implement it.
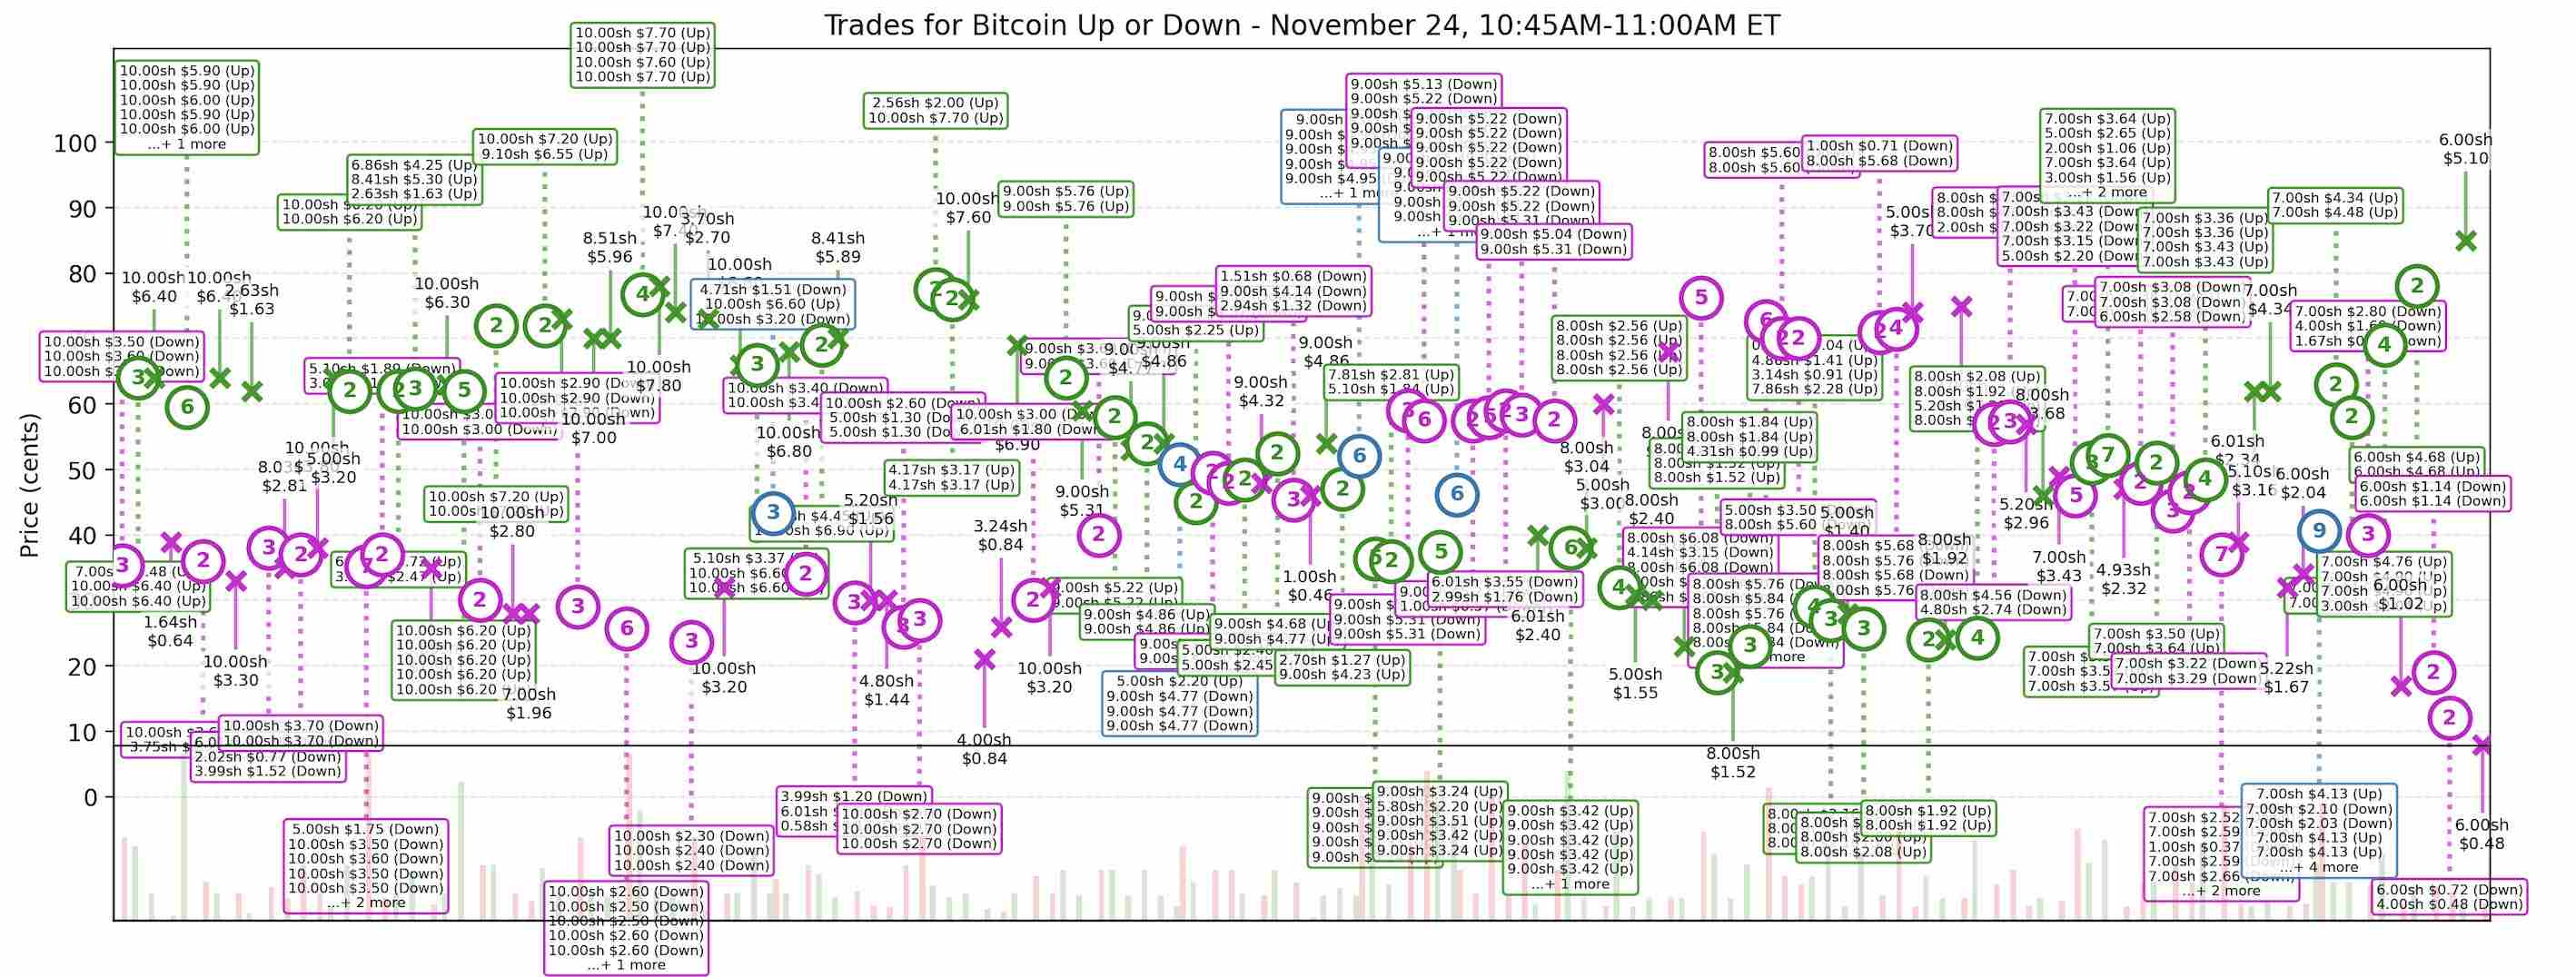
A Real Example From His Trades
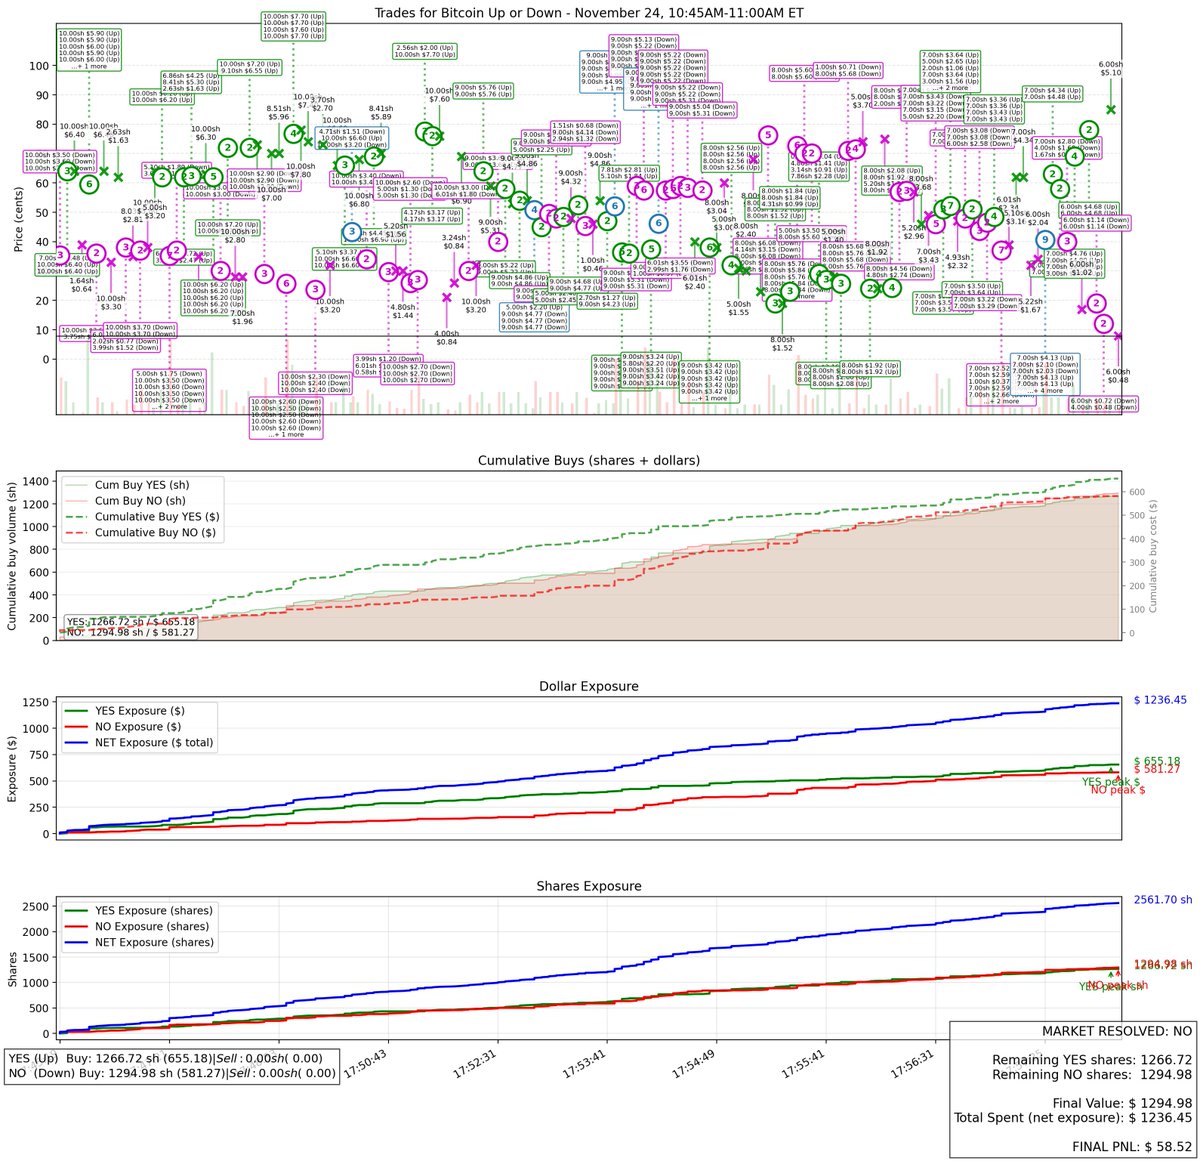
Look carefully at the image above. It contains four layers of insight:
Individual trade dots (YES and NO entries).
Cumulative shares held.
Cumulative dollars spent.
Exposure curves showing total cost vs. total potential payout.
Across a single 15-minute window, look at his precision:
He bought 1266.72 YES shares for 655.18 dollars (avg ≈ 0.517)
He bought 1294.98 NO shares for 581.27 dollars (avg ≈ 0.449)
His combined cost: 0.517 + 0.449 = 0.966
He paid only 96.6 cents for something guaranteed to be worth 1 dollar.
Final profit on this single short window? $58.52.
When you look closer at the chart, notice that the green YES buys appear when the price temporarily dips, and the pink NO buys cluster when sentiment flips. His quantities remain closely balanced, ensuring a safe hedge.
Why This Works: Markets Oscillate More Than You Think
Binary markets should behave like: YES Price + NO Price ≈ 1.00
But real traders inject emotion. You often see YES at 0.20, NO at 0.85. Then minutes later, YES at 0.82, NO at 0.18.
These mispricings are small windows that gabagool captures.
He never needs to guess direction. He simply waits, identifies cheapness, and adds to his position while keeping his averages in check. Over time, the rapid oscillation of sentiment drives his Pair Cost down.
How You Can Replicate This Strategy Today
The best part? This is transparent. Nothing requires secret APIs or insider info.
Step 1: Track Your Totals
Maintain four numbers in a simple spreadsheet: Qty_YES, Qty_NO, Cost_YES, Cost_NO
Step 2: Simulate Before Every Buy
If you consider buying new shares (Δq) at price (P), calculate your new cost basis first.
New Qty = Current Qty + Δq New Cost = Current Cost + (P × Δq)
Check the new combined cost. Only buy if: New Pair Cost < 0.99 (or your safety margin)
Step 3: Keep Quantities Balanced
When Qty_YES ≈ Qty_NO, your hedge is strongest and your guaranteed payout is maximized.
Step 4: Stop Once You Lock Profit
The moment this condition is met:
min(Qty_YES, Qty_NO) > (Cost_YES + Cost_NO)
Stop. The market outcome becomes irrelevant. Price could pump, dump, or go sideways. You are already guaranteed a win.
Step 5: Repeat Every 15 Minutes
Because of the short time window, emotions run hotter and mispricings occur more often. This is why gabagool repeats the strategy multiple times per hour. You can too.
The Visual Proof
almost there
When you look at the chart one last time, the math becomes tangible.
Cumulative Buys: YES and NO quantities moving upward in sync.
Dollar Exposure: Total cost curve stays below total payout curve.
You don’t just understand the strategy. You feel it. You start to see opportunities the same way he does.
Want the exact scripts that generated these visuals?
Comment: AMAZING STATS, and I’ll send you the full chart generator so you can analyze your own trades exactly the same way.
Traders profile: https://polymarket.com/@gabagool22?via=jayden
 Source
 Add to Favorites
 Download image
 Share x
 Copy link
Bitcoin may enter a prolonged sideways phase between $57K and $87K as markets enter a relief period following a 52% drop from ATH. This consolidation could mirror the 2022 fractal, creating liquidity before a potential breakdown toward the $44K–$50K range.
Doctor Profit/2026.03.09

Davinci Jeremie urged people to buy $1 of Bitcoin in 2013 and became a symbol of early conviction. Years later, fame, lifestyle flexing, and token promotions sparked criticism. His journey reflects both crypto foresight and influencer-era controversy.
StarPlatinum/2026.03.04
A sweeping narrative ties Jane Street to India’s expiry-day options case, alleged 10AM Bitcoin sell patterns, Terra’s collapse, and ETF plumbing. While none prove misconduct, critics argue a common structure: move spot, monetize derivatives, keep execution opaque.
Bull Theory/2026.02.27
A controversial narrative links Jane Street, ETF mechanics, and Bitcoin’s price behavior, pointing to lawsuit allegations, 10AM volatility patterns, and derivative hedging dynamics. The discussion raises broader questions about liquidity, structure, and price discovery.
Justin Bechler/2026.02.26
A new federal lawsuit alleges Jane Street exploited non-public information tied to Terraform’s liquidity defenses, accelerating UST’s depeg and the Terra collapse. The firm denies the claims. The case may reignite debates on structure, design, and regulation.
Diana/2026.02.25
Mean reversion and on-chain models sit at levels historically linked to bottom formation after capitulation. Realized losses reached record USD values, while deviations from anchor models remain extreme. Price pain may be fading; patience remains key.
Checkmate/2026.02.25
Hot feeds
A trader profits $448K by monitoring #Binance's new listings!
2024.12.13 17:37:29
Last week, funds have flowed into #Bitcoin, #Ethereum, and #Hyperliquid.
2024.12.16 14:48:36
A $PEPE whale that had been dormant for 600 days transferred all 2.1T $PEPE($52M) to a new address.
2024.12.14 10:35:27
When Elon Musk tweeted about Moltbook, the meme coin MOLT experienced a short-term 30% price surge, hitting a new all-time high of $114 million.
2026.01.31 18:37:29
A smart #AI coin trader made $17.6M on $GOAT, $ai16z, $Fartcoin,$arc.
2025.01.05 16:05:18
A sniper earned 2,277 $ETH ($8.3M) trading $SHIRO within 18 hours!
2024.12.03 23:09:08
MoreHot Articles
How did I turn $1,000 into $30,000 with smart money?
2024.12.09
10 promising AI Agent cryptos
2024.12.05
The 30-Year-Old Entrepreneur Behind Virtual, a Multi-Million Dollar AI Agent Society
2025.01.22
10 smart traders specializing in MEMEcoin trading on Solana
2024.12.09
A trader lost $73.9K trading memecoins in just 3 minutes — a lesson for us all!
2024.12.13
What is $SPORE? Let us take you through the on-chain records to show you how it works.
2024.12.25

