

 App Store
 Profile
 Security
 Sign Out
 Feeds
Feeds
 Articles
5 Key Indicators Show We’re Far From the Bull Market Top
 Leshka.eth
Indicators that I check to predict Top of the Bullrun
a thread 🧵🔽
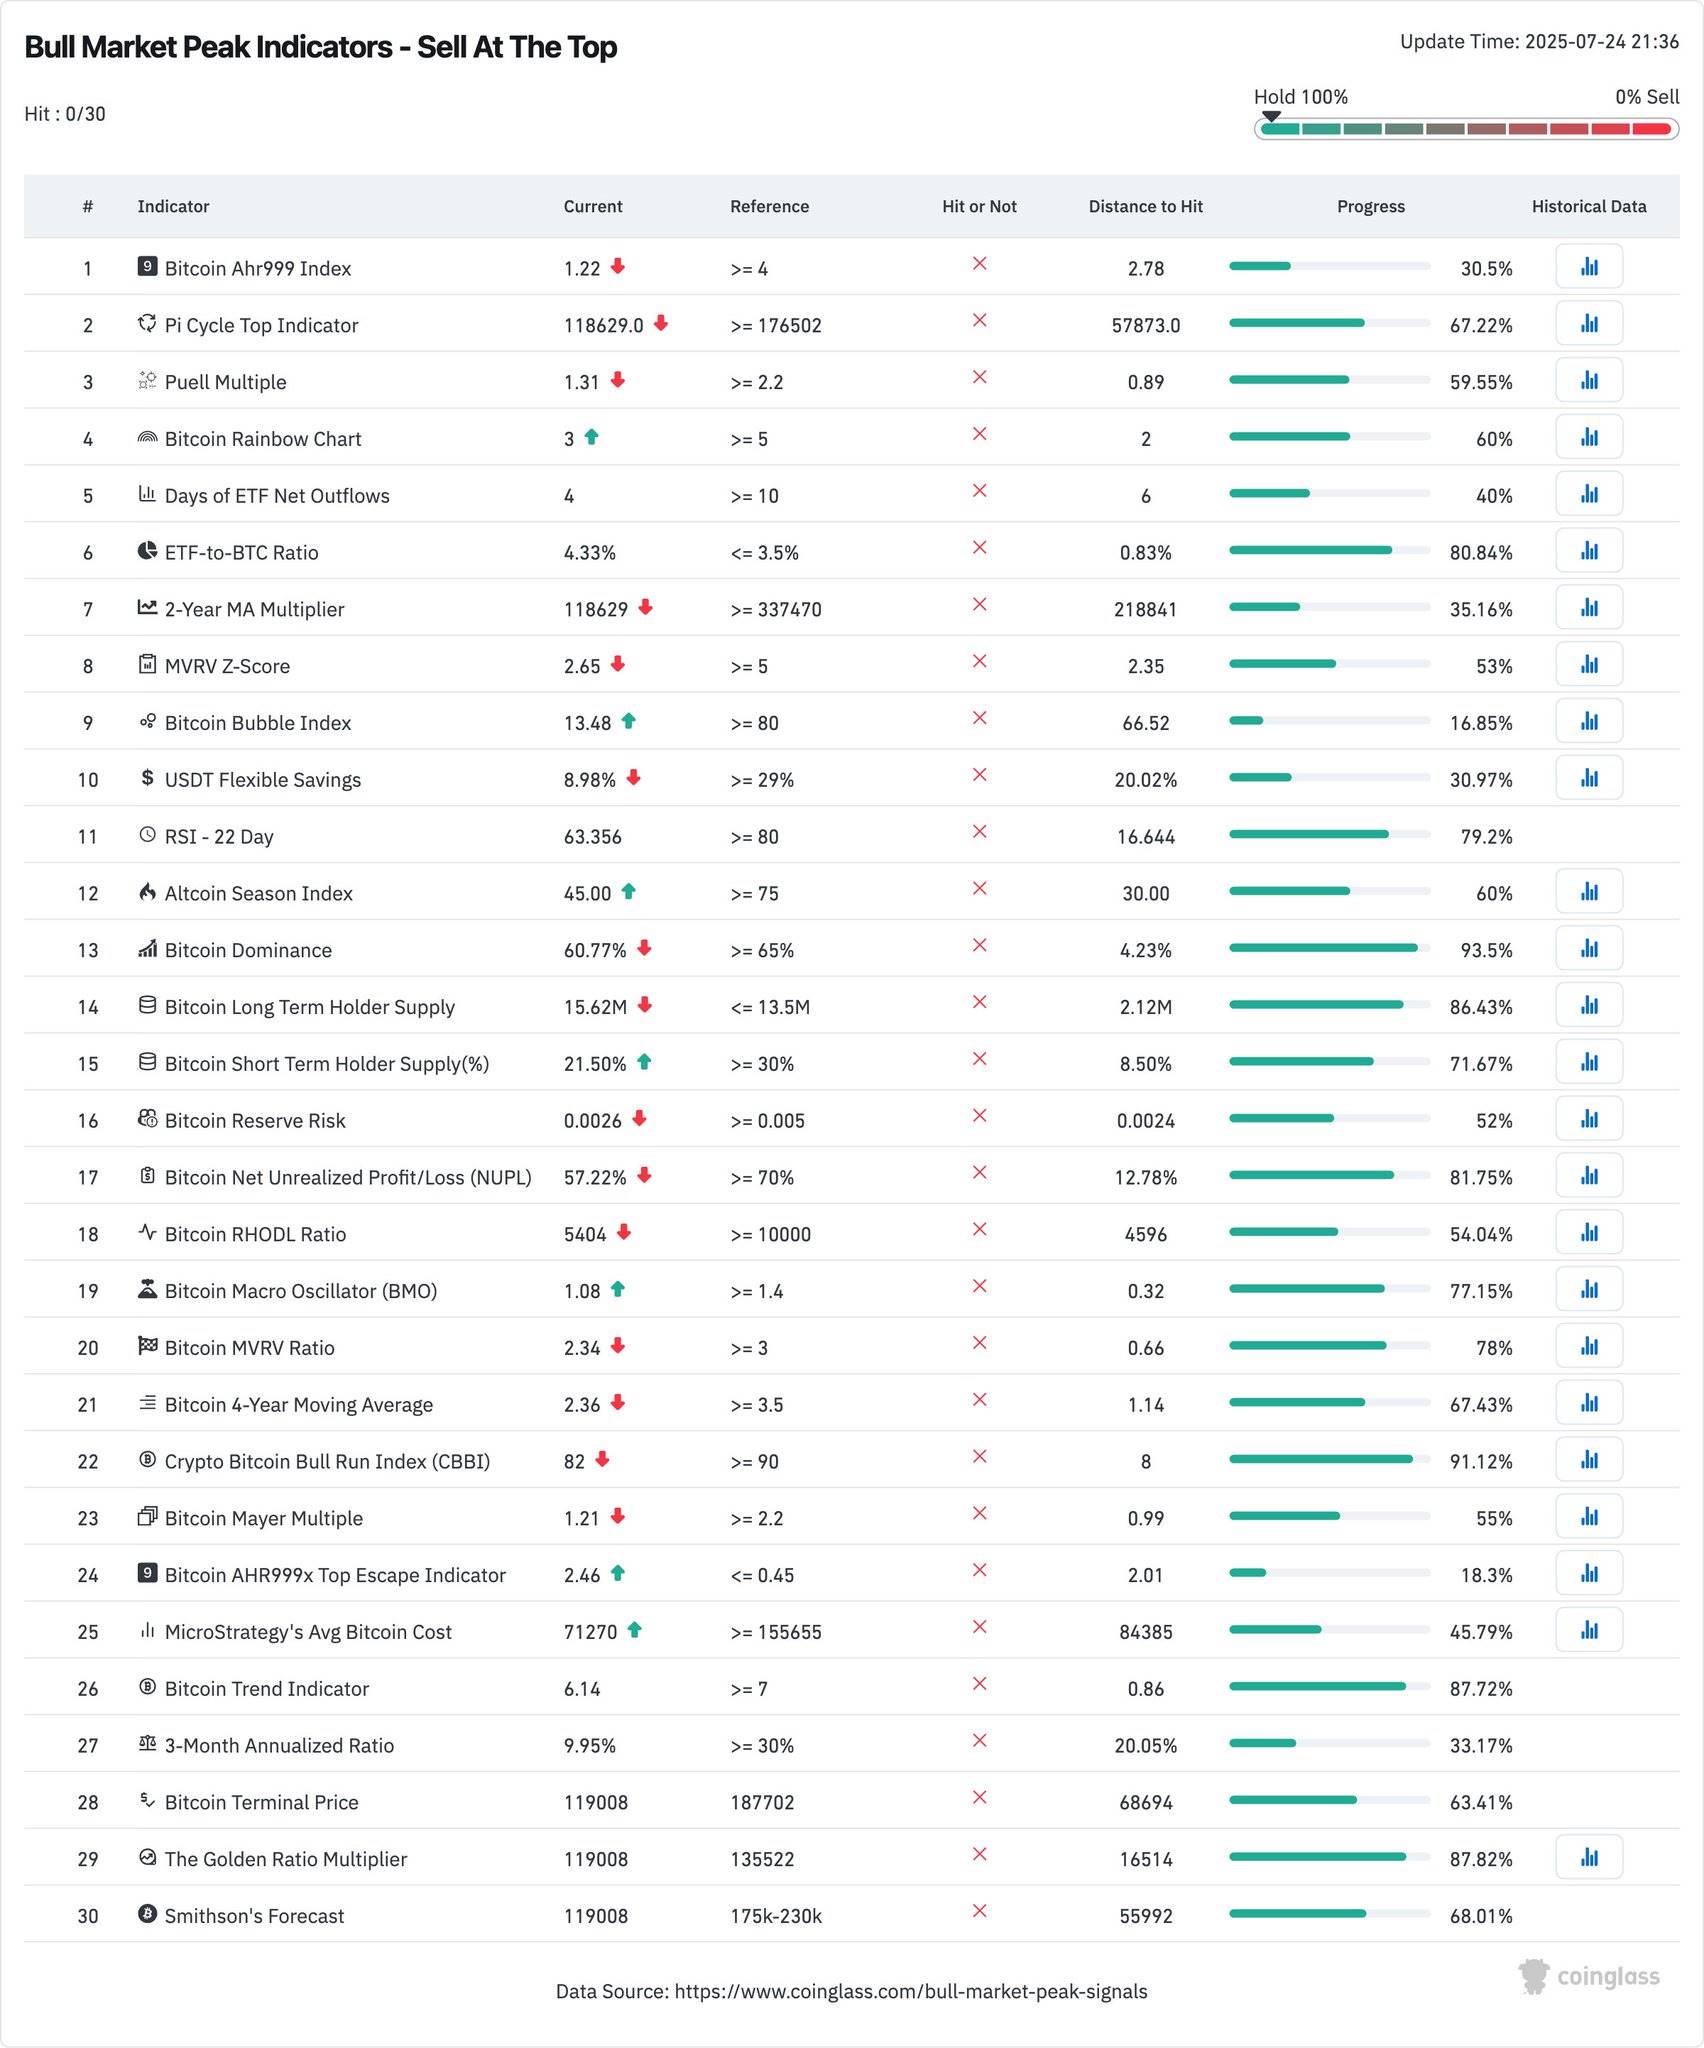
I’ve seen 3 full market cycles & every time majory can't predict the pico top. Never:
• Some say it’s the final top
• Others think it’s just getting started
But if you follow real indicators, the signs are always clear
I mostly monitor 5 major indicators that have accurately signaled every previous market peak:
• Pi Cycle Top
• Bitcoin AHR999 Index
• Puell Multiple
• Rainbow Chart
• Bitcoin Bubble Index
At this moment? None of them are flashing a market top
Here's a breakdown of each👇
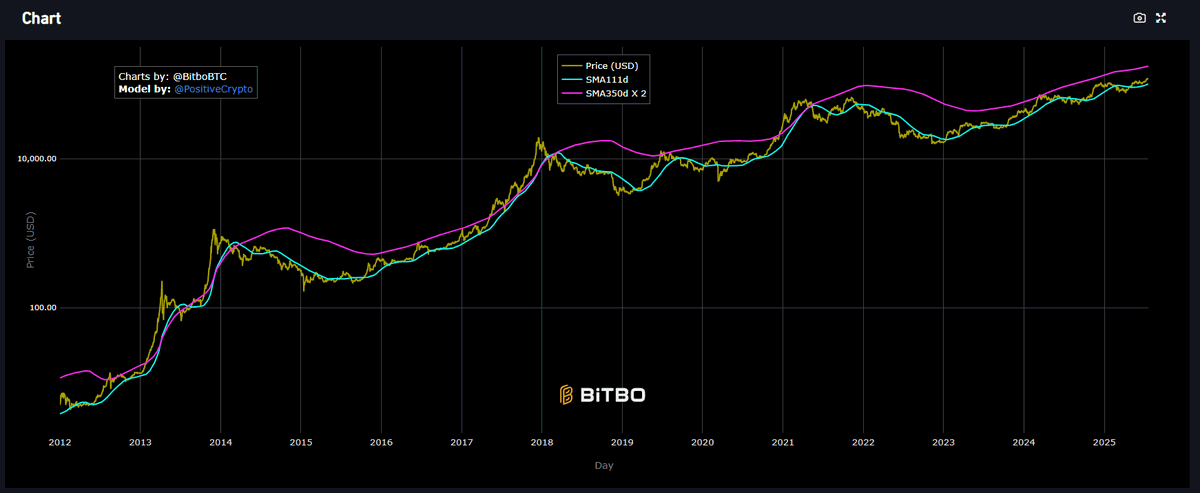
Pi Cycle Top: No signal yet
The 111-day moving average still hasn’t crossed above 2× the 350-day moving average
That precise crossover perfectly marked the tops in 2013, 2017, and April 2021
Currently, we’re only about 69% of the way to that threshold
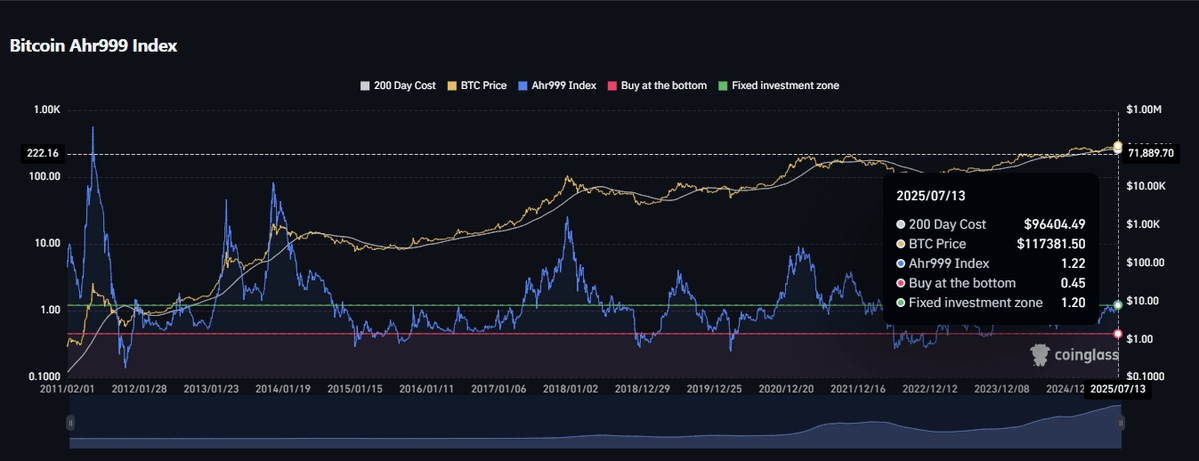
Bitcoin AHR999 Index ≈ 1.22
The risk zone typically begins around 3–4
At the last cycle peak, the index spiked to 9.0
Sitting at 1.25 today, Bitcoin is trading above fair value, but far from bubble territory.
This suggests we’re still mid-cycle
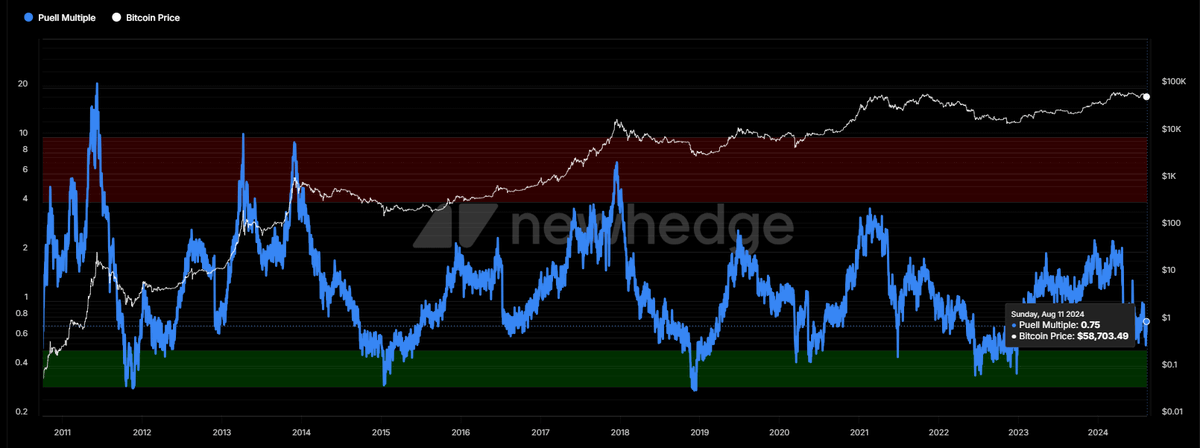
Puell Multiple ≈ 0.8
Historically, major tops form when this hits 4/5 - that’s when miners start heavily selling, triggering corrections
At 0.8 we’re still well below that danger zone
Even with Bitcoin at $120K, miners revenue isn't overstretched
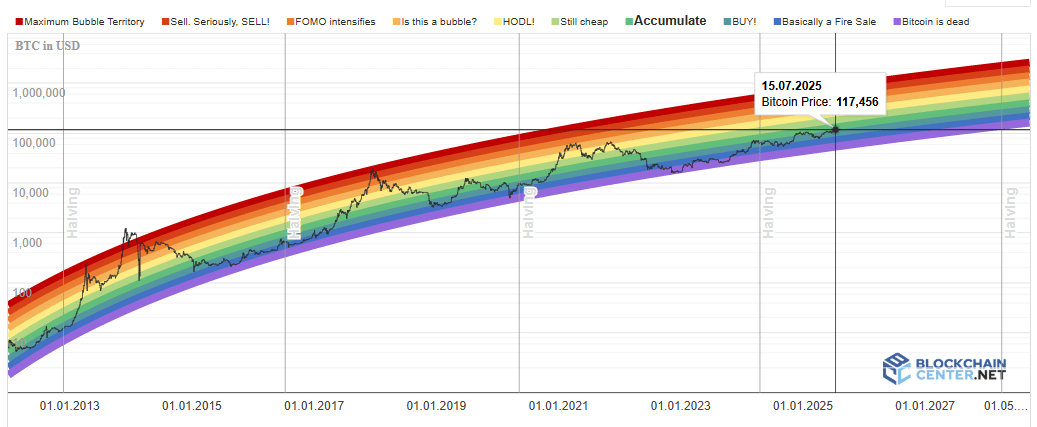
Rainbow Chart: Currently in the green zone
The danger zone sits in bright red - where past blow-off tops have occurred
Right now, Bitcoin is hovering around the middle of the spectrum
According to this model, there's still room for growth before we reach the peak euphoria
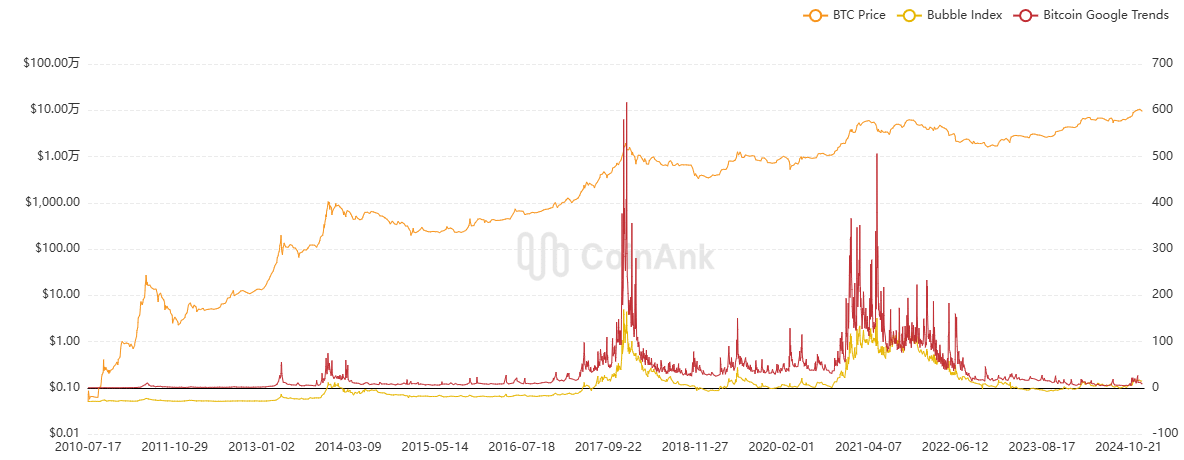
Bitcoin Bubble index: Sitting at 12–15
In past bull market tops, this index soared to 80–100
Today? We're far from that - no hype, no mania, and the retail crowd is still mostly on the sidelines
Search interest is low, inflows are modest, and social sentiment remains quiet
All 5 indicators agree:
• Not overbought
• Not euphoric
• Not the peak
This is a mid-run pause - selling now risks missing the run to $150K+
https://x.com/leshka_eth/status/1944702193409708150
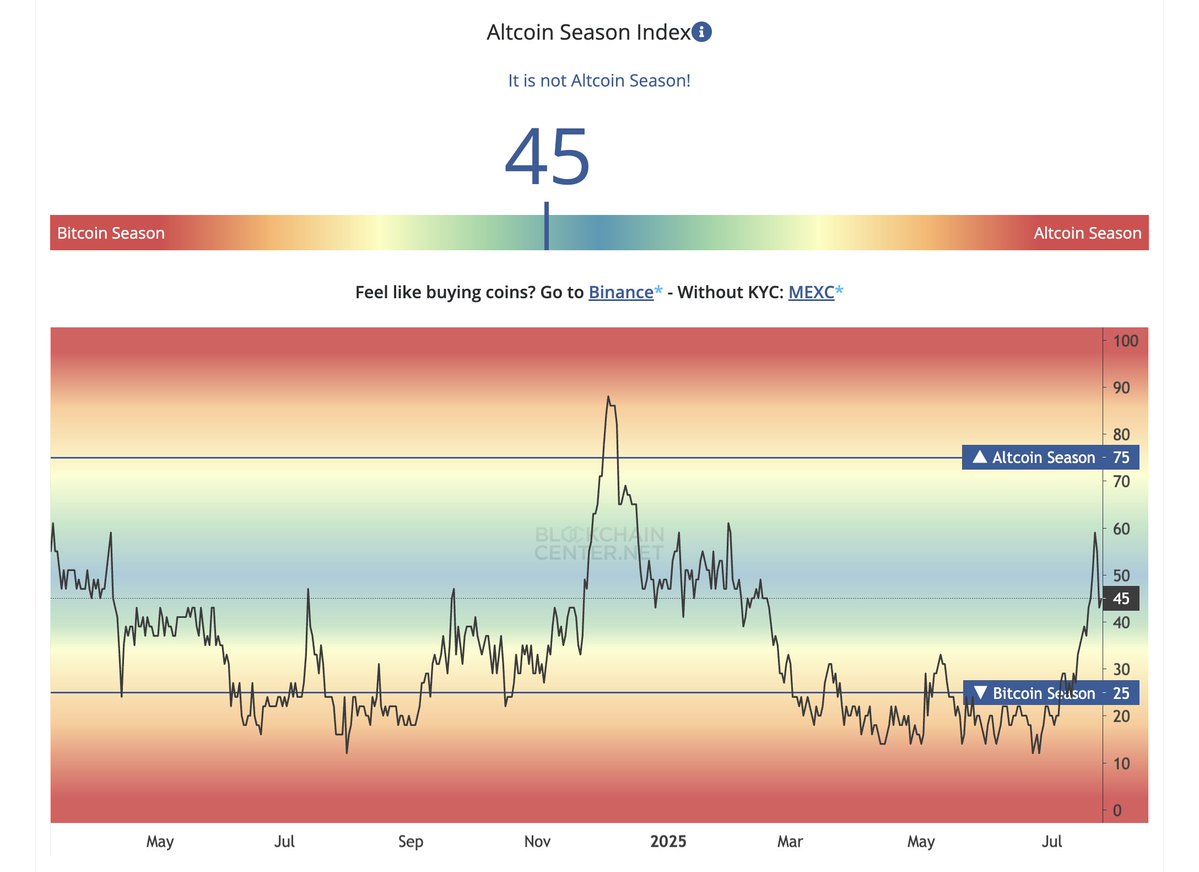
Altseason hasn’t kicked off much yet
The Altseason Index has picked around 50 - it needs to break above 75 to signal a true altseason
BTC dominance remains high, indicating that the market is just starting to shift
Major tops don’t happen before memecoins go parabolic...
What’s the move now?
Stay patient and monitor key signals
Don’t exit positions just because CT feels overheated and depressed about recent $PUMP price action
True market tops arrive with retail FOMO, explosive altcoin rallies, and extreme indicator readings
We’re not in that zone yet.

 Source
 Add to Favorites
 Download image
 Share x
 Copy link
Bitcoin may enter a prolonged sideways phase between $57K and $87K as markets enter a relief period following a 52% drop from ATH. This consolidation could mirror the 2022 fractal, creating liquidity before a potential breakdown toward the $44K–$50K range.
Doctor Profit/2026.03.09

Davinci Jeremie urged people to buy $1 of Bitcoin in 2013 and became a symbol of early conviction. Years later, fame, lifestyle flexing, and token promotions sparked criticism. His journey reflects both crypto foresight and influencer-era controversy.
StarPlatinum/2026.03.04
A sweeping narrative ties Jane Street to India’s expiry-day options case, alleged 10AM Bitcoin sell patterns, Terra’s collapse, and ETF plumbing. While none prove misconduct, critics argue a common structure: move spot, monetize derivatives, keep execution opaque.
Bull Theory/2026.02.27
A controversial narrative links Jane Street, ETF mechanics, and Bitcoin’s price behavior, pointing to lawsuit allegations, 10AM volatility patterns, and derivative hedging dynamics. The discussion raises broader questions about liquidity, structure, and price discovery.
Justin Bechler/2026.02.26
A new federal lawsuit alleges Jane Street exploited non-public information tied to Terraform’s liquidity defenses, accelerating UST’s depeg and the Terra collapse. The firm denies the claims. The case may reignite debates on structure, design, and regulation.
Diana/2026.02.25
Mean reversion and on-chain models sit at levels historically linked to bottom formation after capitulation. Realized losses reached record USD values, while deviations from anchor models remain extreme. Price pain may be fading; patience remains key.
Checkmate/2026.02.25
Hot feeds
A trader profits $448K by monitoring #Binance's new listings!
2024.12.13 17:37:29
Last week, funds have flowed into #Bitcoin, #Ethereum, and #Hyperliquid.
2024.12.16 14:48:36
A $PEPE whale that had been dormant for 600 days transferred all 2.1T $PEPE($52M) to a new address.
2024.12.14 10:35:27
When Elon Musk tweeted about Moltbook, the meme coin MOLT experienced a short-term 30% price surge, hitting a new all-time high of $114 million.
2026.01.31 18:37:29
A smart #AI coin trader made $17.6M on $GOAT, $ai16z, $Fartcoin,$arc.
2025.01.05 16:05:18
A sniper earned 2,277 $ETH ($8.3M) trading $SHIRO within 18 hours!
2024.12.03 23:09:08
MoreHot Articles
How did I turn $1,000 into $30,000 with smart money?
2024.12.09
10 promising AI Agent cryptos
2024.12.05
The 30-Year-Old Entrepreneur Behind Virtual, a Multi-Million Dollar AI Agent Society
2025.01.22
10 smart traders specializing in MEMEcoin trading on Solana
2024.12.09
A trader lost $73.9K trading memecoins in just 3 minutes — a lesson for us all!
2024.12.13
What is $SPORE? Let us take you through the on-chain records to show you how it works.
2024.12.25

