

 App Store
 Profile
 Security
 Sign Out
 Feeds
Feeds
 Articles
Bitcoins True Death Cross: Why This Breakdown Marks the Start of a Bear Market
 Doctor Profit
Bitcoin – What’s Next?
The Big Sunday Report: All You Need to Know:
🚩 TA / LCA / Psychological Breakdown:
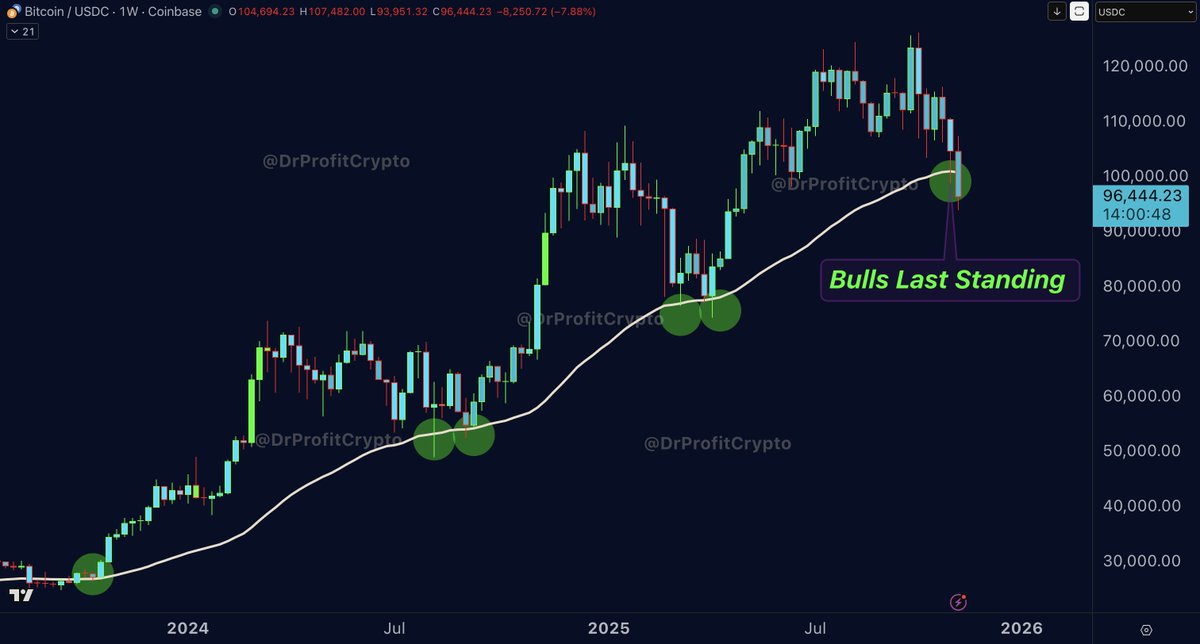
It’s very important to understand the chart below and the significance of the golden line, which is the EMA50. I predicted the breakdown of this line back in September when I said that BTC would fall below 100k and break beneath the golden line. This chart is crucial because it indicates whether BTC is in a bull or bear market. Historically, every time BTC touched this area, it closed the weekly candle right above it and always bounced afterwards. Throughout the entire cycle since 2024, Bitcoin consistently closed above this level, confirming the bull market we were in. Now it has dropped below it exactly as I predicted, and confirming the bearish sentiment. This chart is extremely important for understanding the concept of the death cross and why many people are mistaken when calling the current death cross a bullish event.
Today, Bitcoin experienced a death cross for the first time since April 2025. Before that, we had a death cross on August 10th, 2024, and another one on September 12th, 2023. On all three of these dates, BTC rallied between 25% and 60% within the following three months after the death cross occurred. Bulls argue that today’s bearish death cross is a bullish signal based on these historical examples. However, they are missing one very important fact. Every time we saw a death cross in the past, Bitcoin was trading well above the weekly EMA50. For example, in April 2025, the death cross happened while Bitcoin was 12% above the EMA50. On August 10th, 2024, Bitcoin was 17% above the EMA50 at the moment of the death cross.
This time, the situation is entirely different, and people are completely ignoring it. Today’s death cross occurred while Bitcoin was trading 6% below the EMA50. This is a very important point that is being overlooked as we speak.
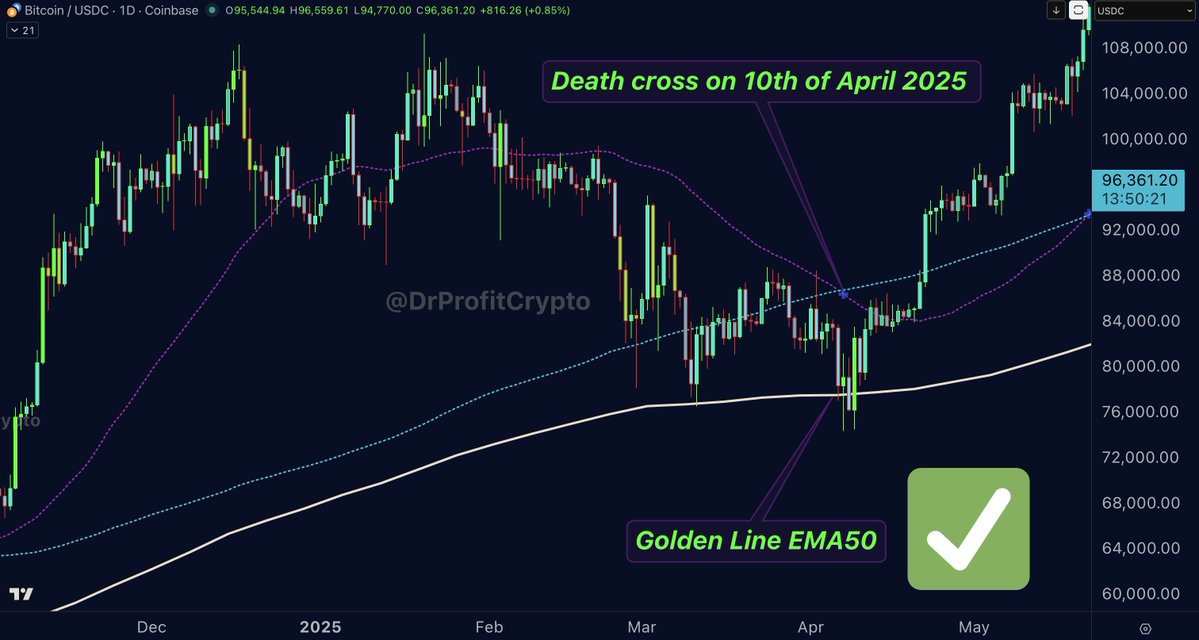
Check the chart above:
Death cross happened on 10th April 2025 ✅
Golden Line EMA50 - HOLD STRONG ✅
Confirmation of Fake Death cross - BULLISH!
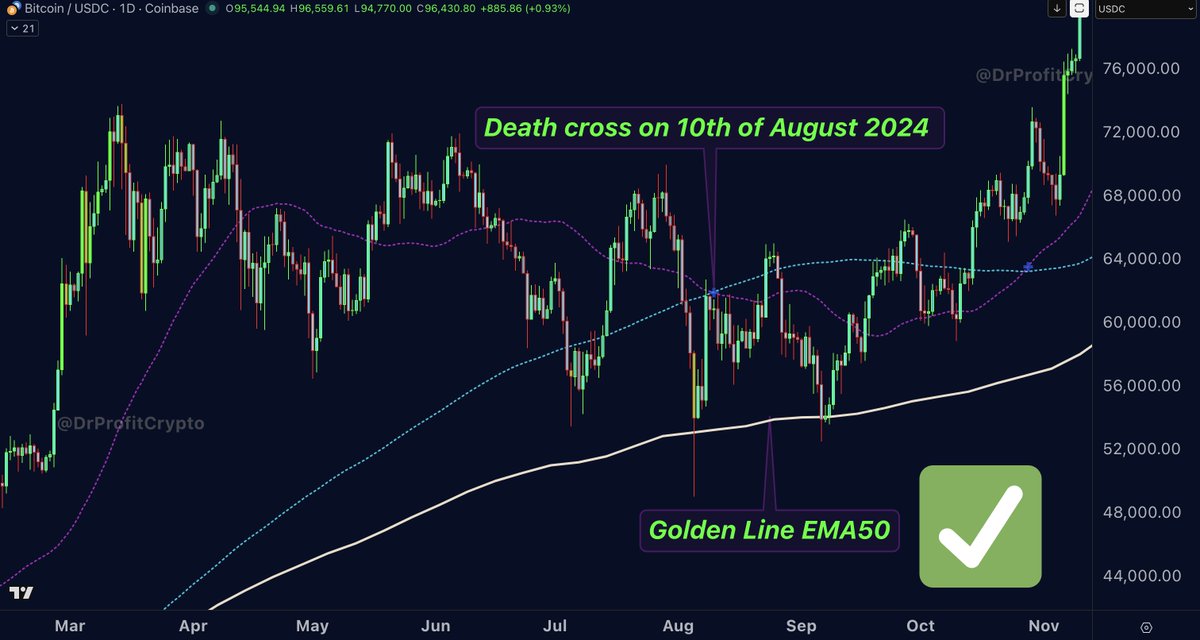
Check the chart above:
Death cross happened on 10th August 2024 ✅
Golden Line EMA50 - HOLD STRONG ✅
Confirmation of Fake Death cross - BULLISH!
The same applies for the Death cross that happened in 2023, Bitcoin always respected the golden line. Now lets have a look what happened today:
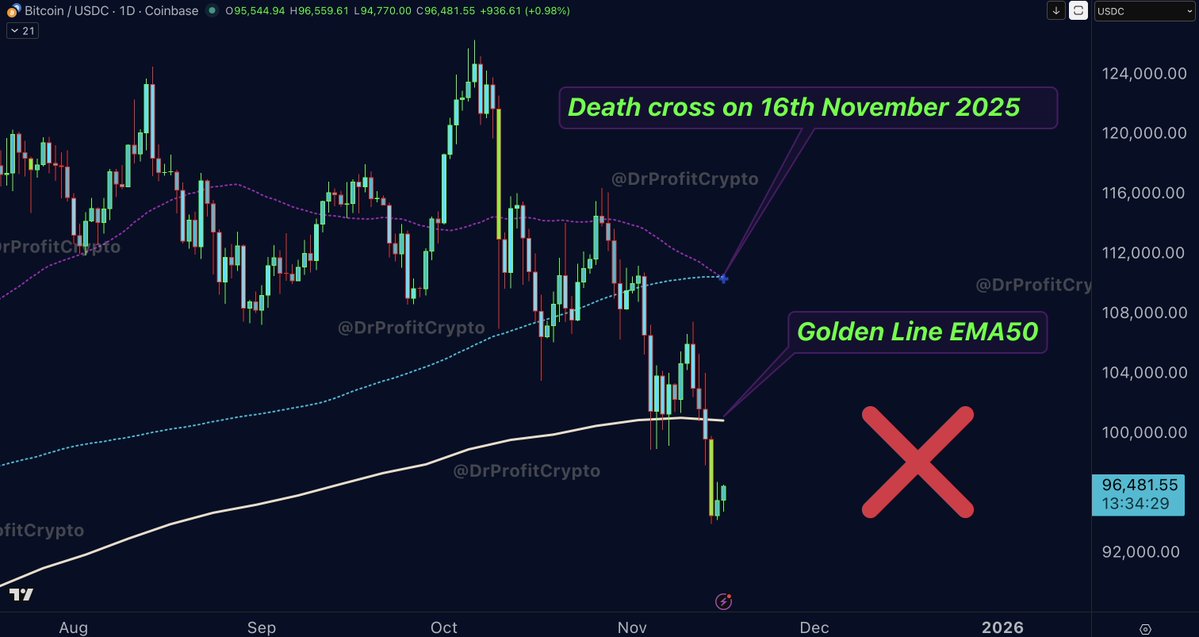
Check the chart above:
Death cross happened TODAY ✅
Golden Line EMA50 - FAILED TO HOLD 🚨
Confirmation of TRUE Death cross - BEARISH!
This is one of the most important facts people completely overlook. They compare the death cross using numbers only. Yes, in the last three events we saw three strong bounces, but in all three events the EMA50 was holding at the same time. On top of that, every previous death cross occurred while Bitcoin was above the EMA50. This time, the situation is fundamentally different. The EMA50 has already failed, and the death cross happened while BTC was below the EMA50. That is a significant DIFFERENCE, and the key point everyone is ignoring.
This is why anyone claiming that today’s death cross is bullish will be proven wrong. Ask them what supports their idea that this death cross is bullish. They will point to the last three events. Then ask them about the golden line (EMA50) during those events. They will admit that Bitcoin respected it and bounced off it every time. Ask them what’s happening with today’s EMA50. That’s when they realise they’ve been wrong the entire time. Someone needs to point this out, and I’m doing exactly that. I hope you understand.
So in total, I consider the argument of a “bullish death cross” a very weak one, it’s simply a desperate attempt by the bulls to showcase whatever remains of their bullish narrative. It’s also important to mention that many bulls repeat the idea that “Fear and Greed Index at extreme lows = bottom.” This is completely wrong if we are in the early stages of a bear market. I still remember when Bitcoin dropped from 68k to 50k in 2021 and the Fear and Greed Index hit 16, which is extreme fear. In the months that followed, BTC continued its downside move until it reached the 16–18k region. Today we see the Fear and Greed Index at extreme fear levels around 10, but this does not mean the crash is over. Extreme fear does not equal a bottom when macro structure and market indicators confirm the start of a deeper bearish phase.
It’s also important to note that during the correction phases throughout 2024 and 2025, we repeatedly saw the same pattern: whenever ETFs sold, whales were the ones accumulating. But this time the chart looks completely different and significantly more negative. ETFs are selling, and whale net volume is also negative. This creates a combined bearish price sentiment and adds substantial selling pressure to BTC. On top of that, the average BTC buyer from the last six months has an average entry of $94,600. Bringing the price back toward $94,600, or below it will trigger even more selling pressure, as short-term traders historically tend to sell at breakeven or even at a slight loss.
This combination of ETF selling, whale selling, and a large cluster of sellers sitting at breakeven levels is a dangerous setup and adds to the bearish case. Not to ignore the entire macro economic risks, such from the REPO market, which I have predicted back in September already. The pressure can be felt these days, and its just the beginning. For much more sell pressure!
Enjoy your tea, wait, dont over-trade.
Regarding #Bitcoin, my position remains the same: fully in USDT, with shorts averaging an entry around 119K.
THIS IS NOT FINANCIAL ADVICE BUT EDUCATIONAL CONTENT ONLY. ALL WRITTEN HERE IS MY OPINION AND MY OWN TRADING AND INVESTING STRATEGY
 Source
 Add to Favorites
 Download image
 Share x
 Copy link
Bitcoin may enter a prolonged sideways phase between $57K and $87K as markets enter a relief period following a 52% drop from ATH. This consolidation could mirror the 2022 fractal, creating liquidity before a potential breakdown toward the $44K–$50K range.
Doctor Profit/2026.03.09

Davinci Jeremie urged people to buy $1 of Bitcoin in 2013 and became a symbol of early conviction. Years later, fame, lifestyle flexing, and token promotions sparked criticism. His journey reflects both crypto foresight and influencer-era controversy.
StarPlatinum/2026.03.04
A sweeping narrative ties Jane Street to India’s expiry-day options case, alleged 10AM Bitcoin sell patterns, Terra’s collapse, and ETF plumbing. While none prove misconduct, critics argue a common structure: move spot, monetize derivatives, keep execution opaque.
Bull Theory/2026.02.27
A controversial narrative links Jane Street, ETF mechanics, and Bitcoin’s price behavior, pointing to lawsuit allegations, 10AM volatility patterns, and derivative hedging dynamics. The discussion raises broader questions about liquidity, structure, and price discovery.
Justin Bechler/2026.02.26
A new federal lawsuit alleges Jane Street exploited non-public information tied to Terraform’s liquidity defenses, accelerating UST’s depeg and the Terra collapse. The firm denies the claims. The case may reignite debates on structure, design, and regulation.
Diana/2026.02.25
Mean reversion and on-chain models sit at levels historically linked to bottom formation after capitulation. Realized losses reached record USD values, while deviations from anchor models remain extreme. Price pain may be fading; patience remains key.
Checkmate/2026.02.25
Hot feeds
A trader profits $448K by monitoring #Binance's new listings!
2024.12.13 17:37:29
Last week, funds have flowed into #Bitcoin, #Ethereum, and #Hyperliquid.
2024.12.16 14:48:36
A $PEPE whale that had been dormant for 600 days transferred all 2.1T $PEPE($52M) to a new address.
2024.12.14 10:35:27
When Elon Musk tweeted about Moltbook, the meme coin MOLT experienced a short-term 30% price surge, hitting a new all-time high of $114 million.
2026.01.31 18:37:29
A smart #AI coin trader made $17.6M on $GOAT, $ai16z, $Fartcoin,$arc.
2025.01.05 16:05:18
A sniper earned 2,277 $ETH ($8.3M) trading $SHIRO within 18 hours!
2024.12.03 23:09:08
MoreHot Articles
How did I turn $1,000 into $30,000 with smart money?
2024.12.09
10 promising AI Agent cryptos
2024.12.05
The 30-Year-Old Entrepreneur Behind Virtual, a Multi-Million Dollar AI Agent Society
2025.01.22
10 smart traders specializing in MEMEcoin trading on Solana
2024.12.09
A trader lost $73.9K trading memecoins in just 3 minutes — a lesson for us all!
2024.12.13
What is $SPORE? Let us take you through the on-chain records to show you how it works.
2024.12.25

