
 App Store
 Profile
 Security
 Sign Out
 Feeds
Feeds
 Articles
The Ultimate Order Book Guide: Mastering Heatmaps, Depth, and Overlays in Crypto Trading
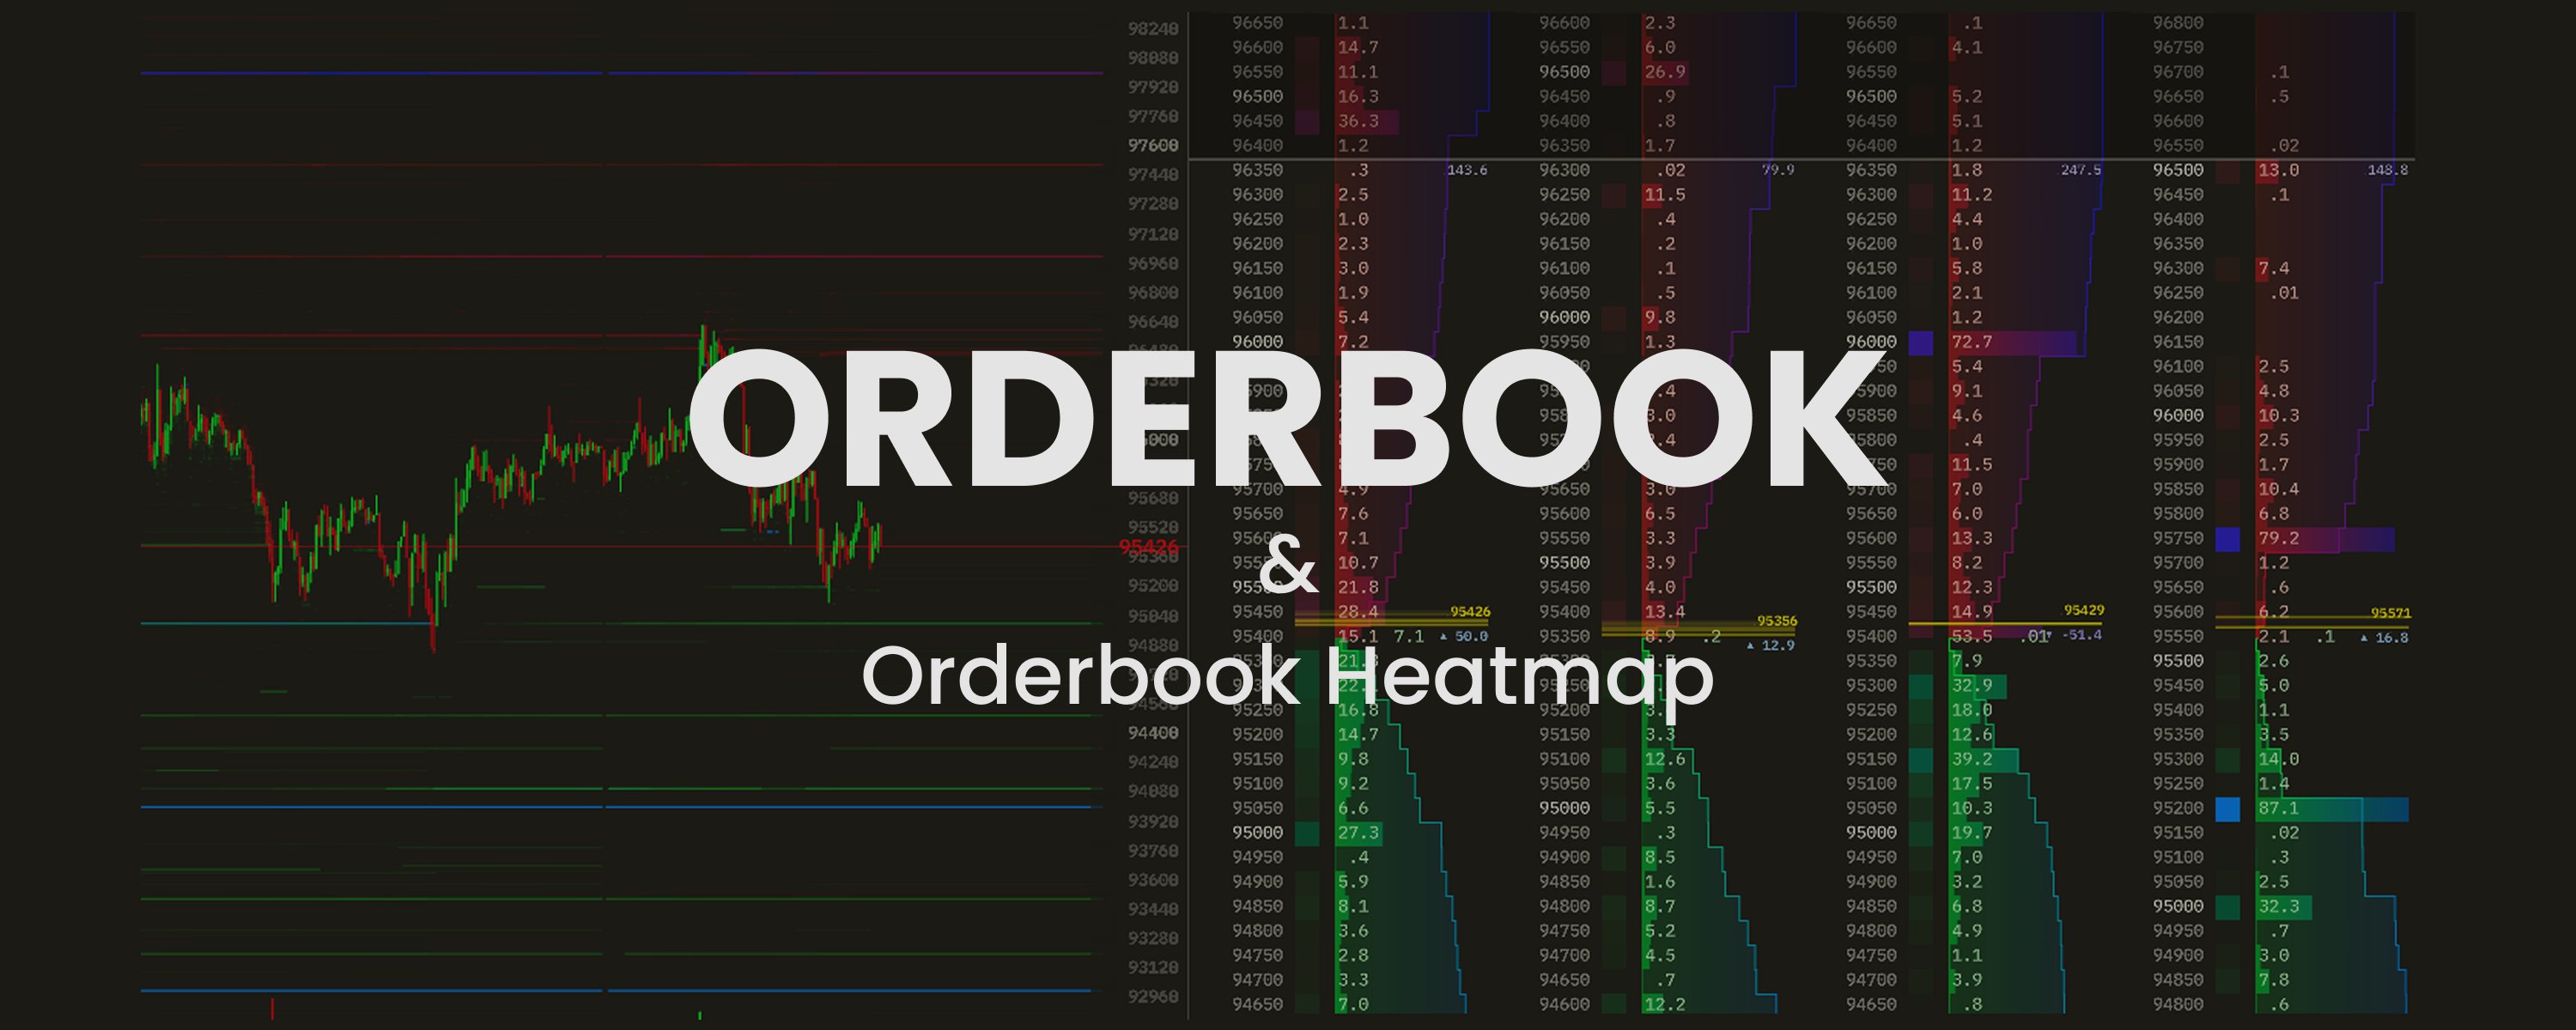
The Ultimate Order Book Guide: Heatmap, Depth and Overlay
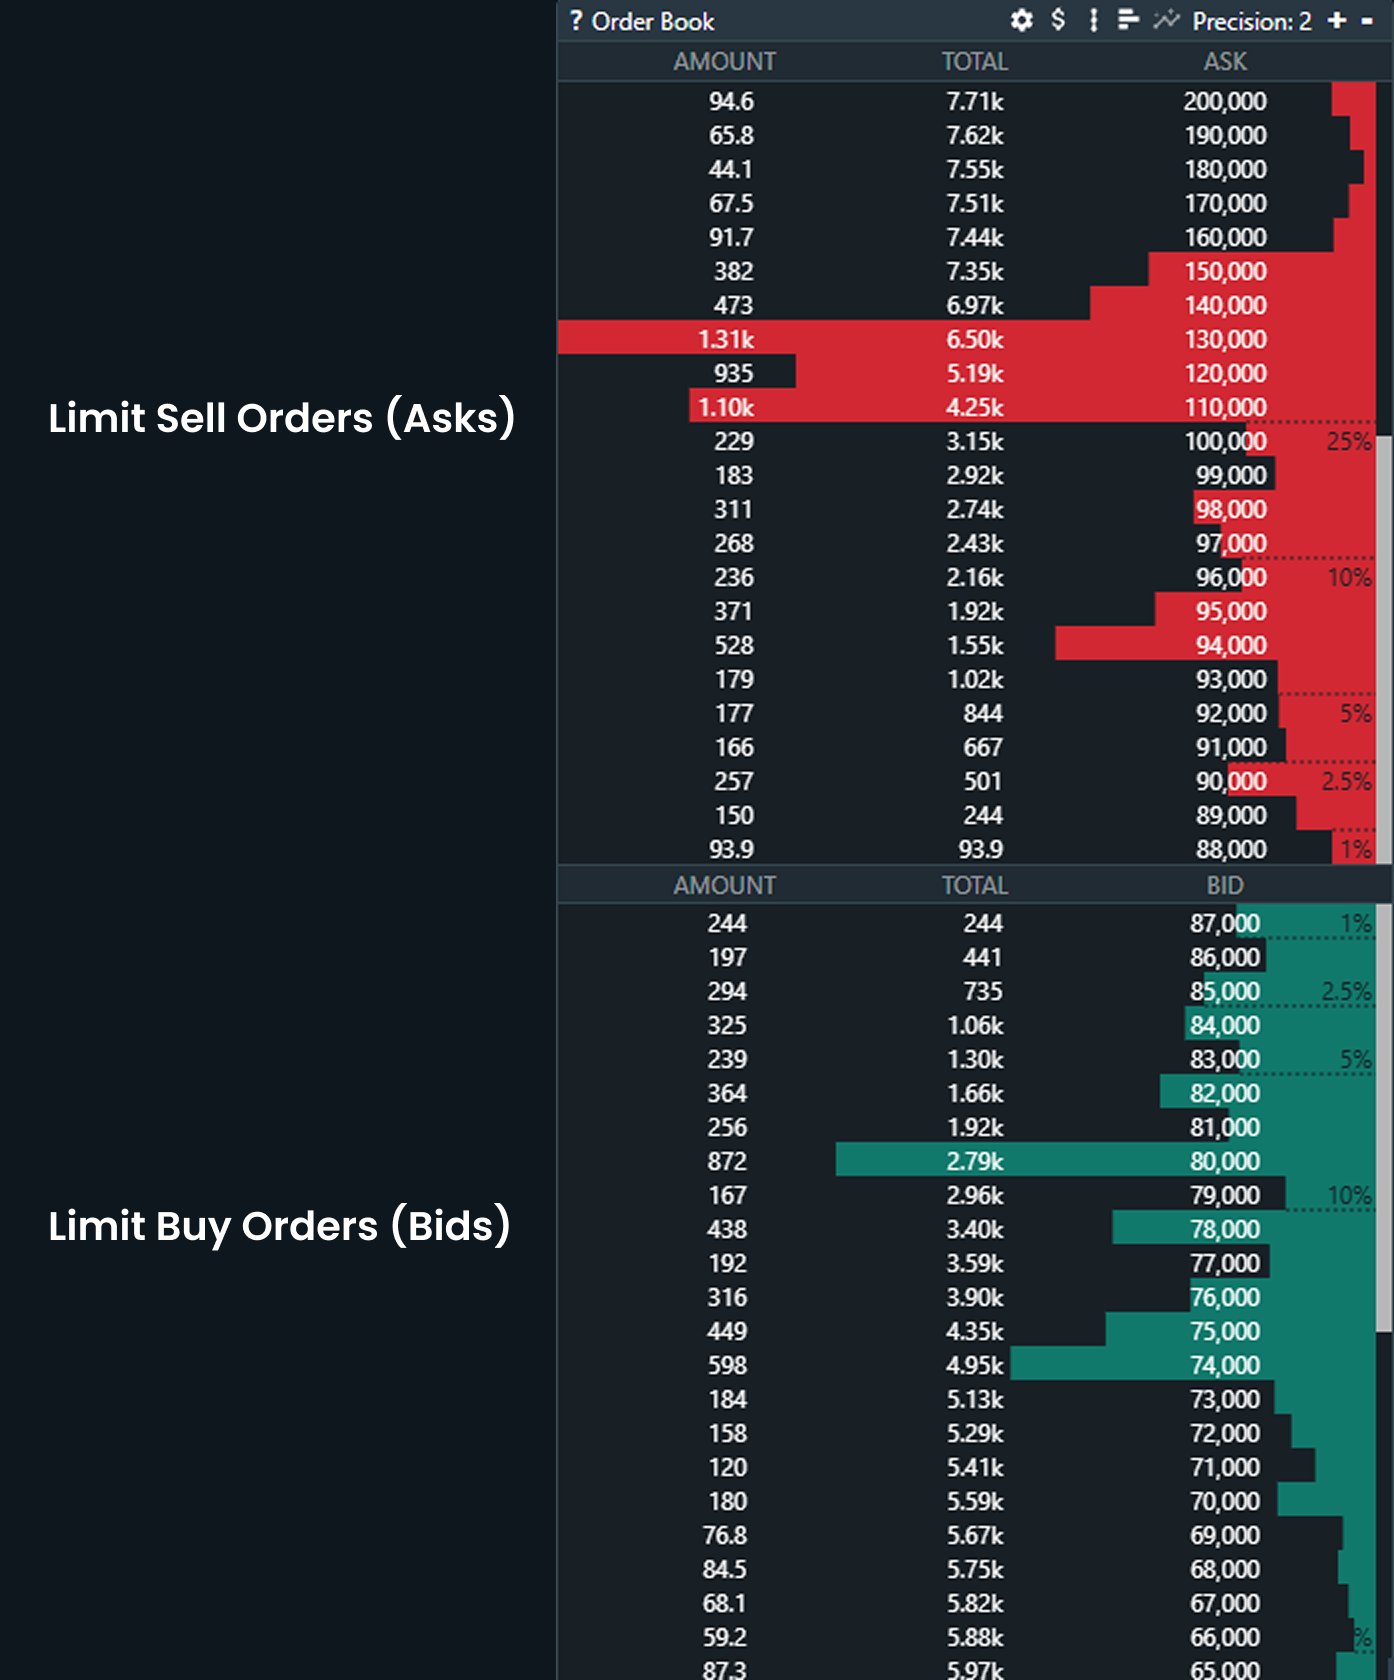
An order book is a real-time list of all open buy and sell limit orders for a specific trading pair (e.g., BTC/USDT) on an exchange.
It shows two sides:
Bids (buy orders) – people willing to buy at certain prices or lower
Asks (sell orders) – people willing to sell at certain prices or higher
Key elements you see in an order book:
Price – the level someone is willing to buy or sell at
Amount / Size – how much they want to trade at that price
Total (cumulative) – running sum of how much volume is available up to that price
The Order Book is essentially a battle between Limit Orders and Market Orders.
Limit Orders are passive - they wait on the board, establishing the liquidity and depth (the "walls" you see).
Market Orders are aggressive - they immediately cross the spread and consume the waiting Limit Orders, causing the price to move. A large market order will "eat through" multiple layers of passive limit liquidity.
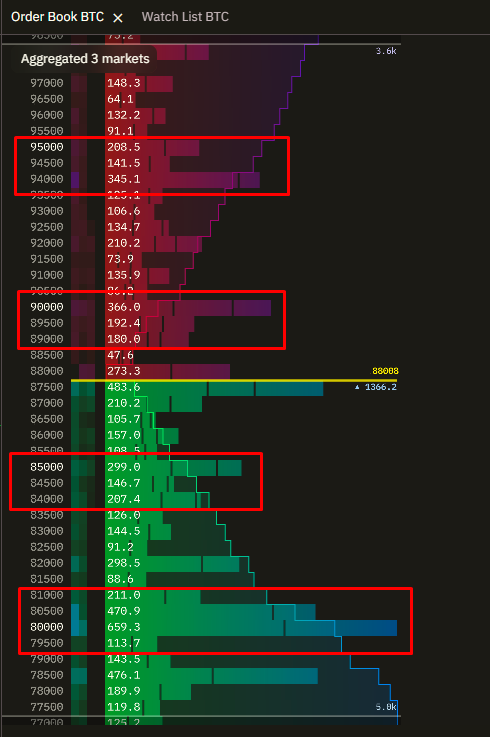
Order books provide valuable insight into where real supply and demand are positioned. While most traders rely on technical analysis to mark support and resistance, the order book helps confirm whether actual orders are sitting at those levels.
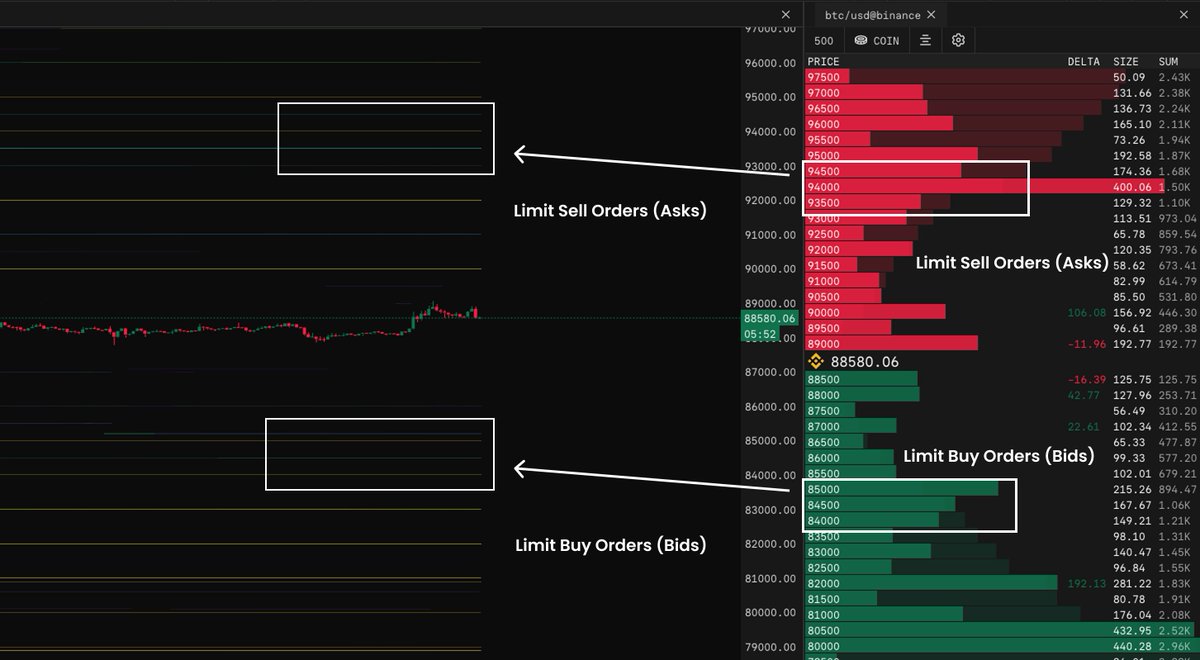
In some cases, major levels can be identified directly from the order book itself. In the screenshot below, supply and demand zones are highlighted with red rectangles, this is the primary role of order books in our analysis: spotting large limit orders and using that information to our advantage.
For best results, focus on Binance Spot and Coinbase order books, as they hold the deepest and most reliable liquidity. Example of large asks and bids in the order book:
What is "Heatmap"?
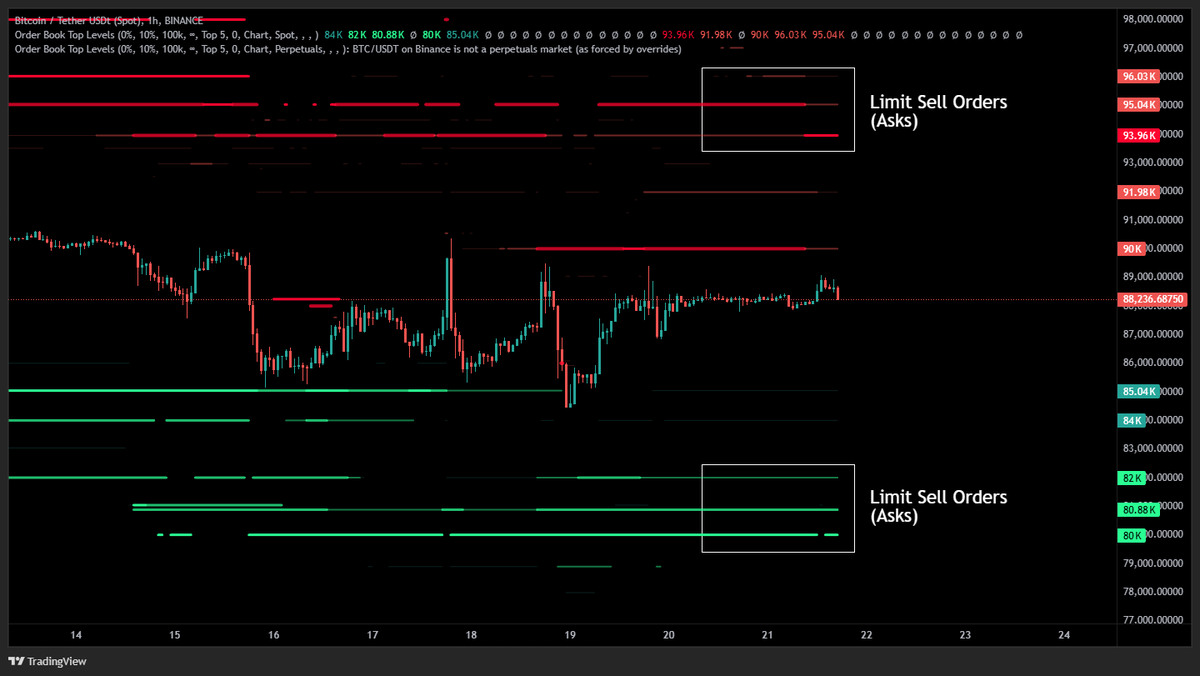
A heatmap visualizes the order book on the chart over time.
In the chart below you can see:
Red lines = large resting sell orders (liquidity / sell walls)
Green lines = large resting buy orders (liquidity / buy walls)
It shows where big players might be trying to buy, sell, or trap price. Helps spot potential reversals, fakeouts, or areas of high interest on the chart.
Now that we understand how the order book and heatmap work individually, let’s put them on the same screen to build a solid foundation for truly understanding market liquidity.
Keep in mind that heatmaps can be visualized differently depending on the platform. Some websites use different color schemes for bids and asks regardless of the colors, the rule stays the same:
asks are always above price, bids are always below price.
Most platforms allow you to filter liquidity using a slider, helping you hide smaller orders (market maker orders) and focus only on large, meaningful levels. Also, you can hover on the line on the heatmap to see how big of an order is placed at that exact level.
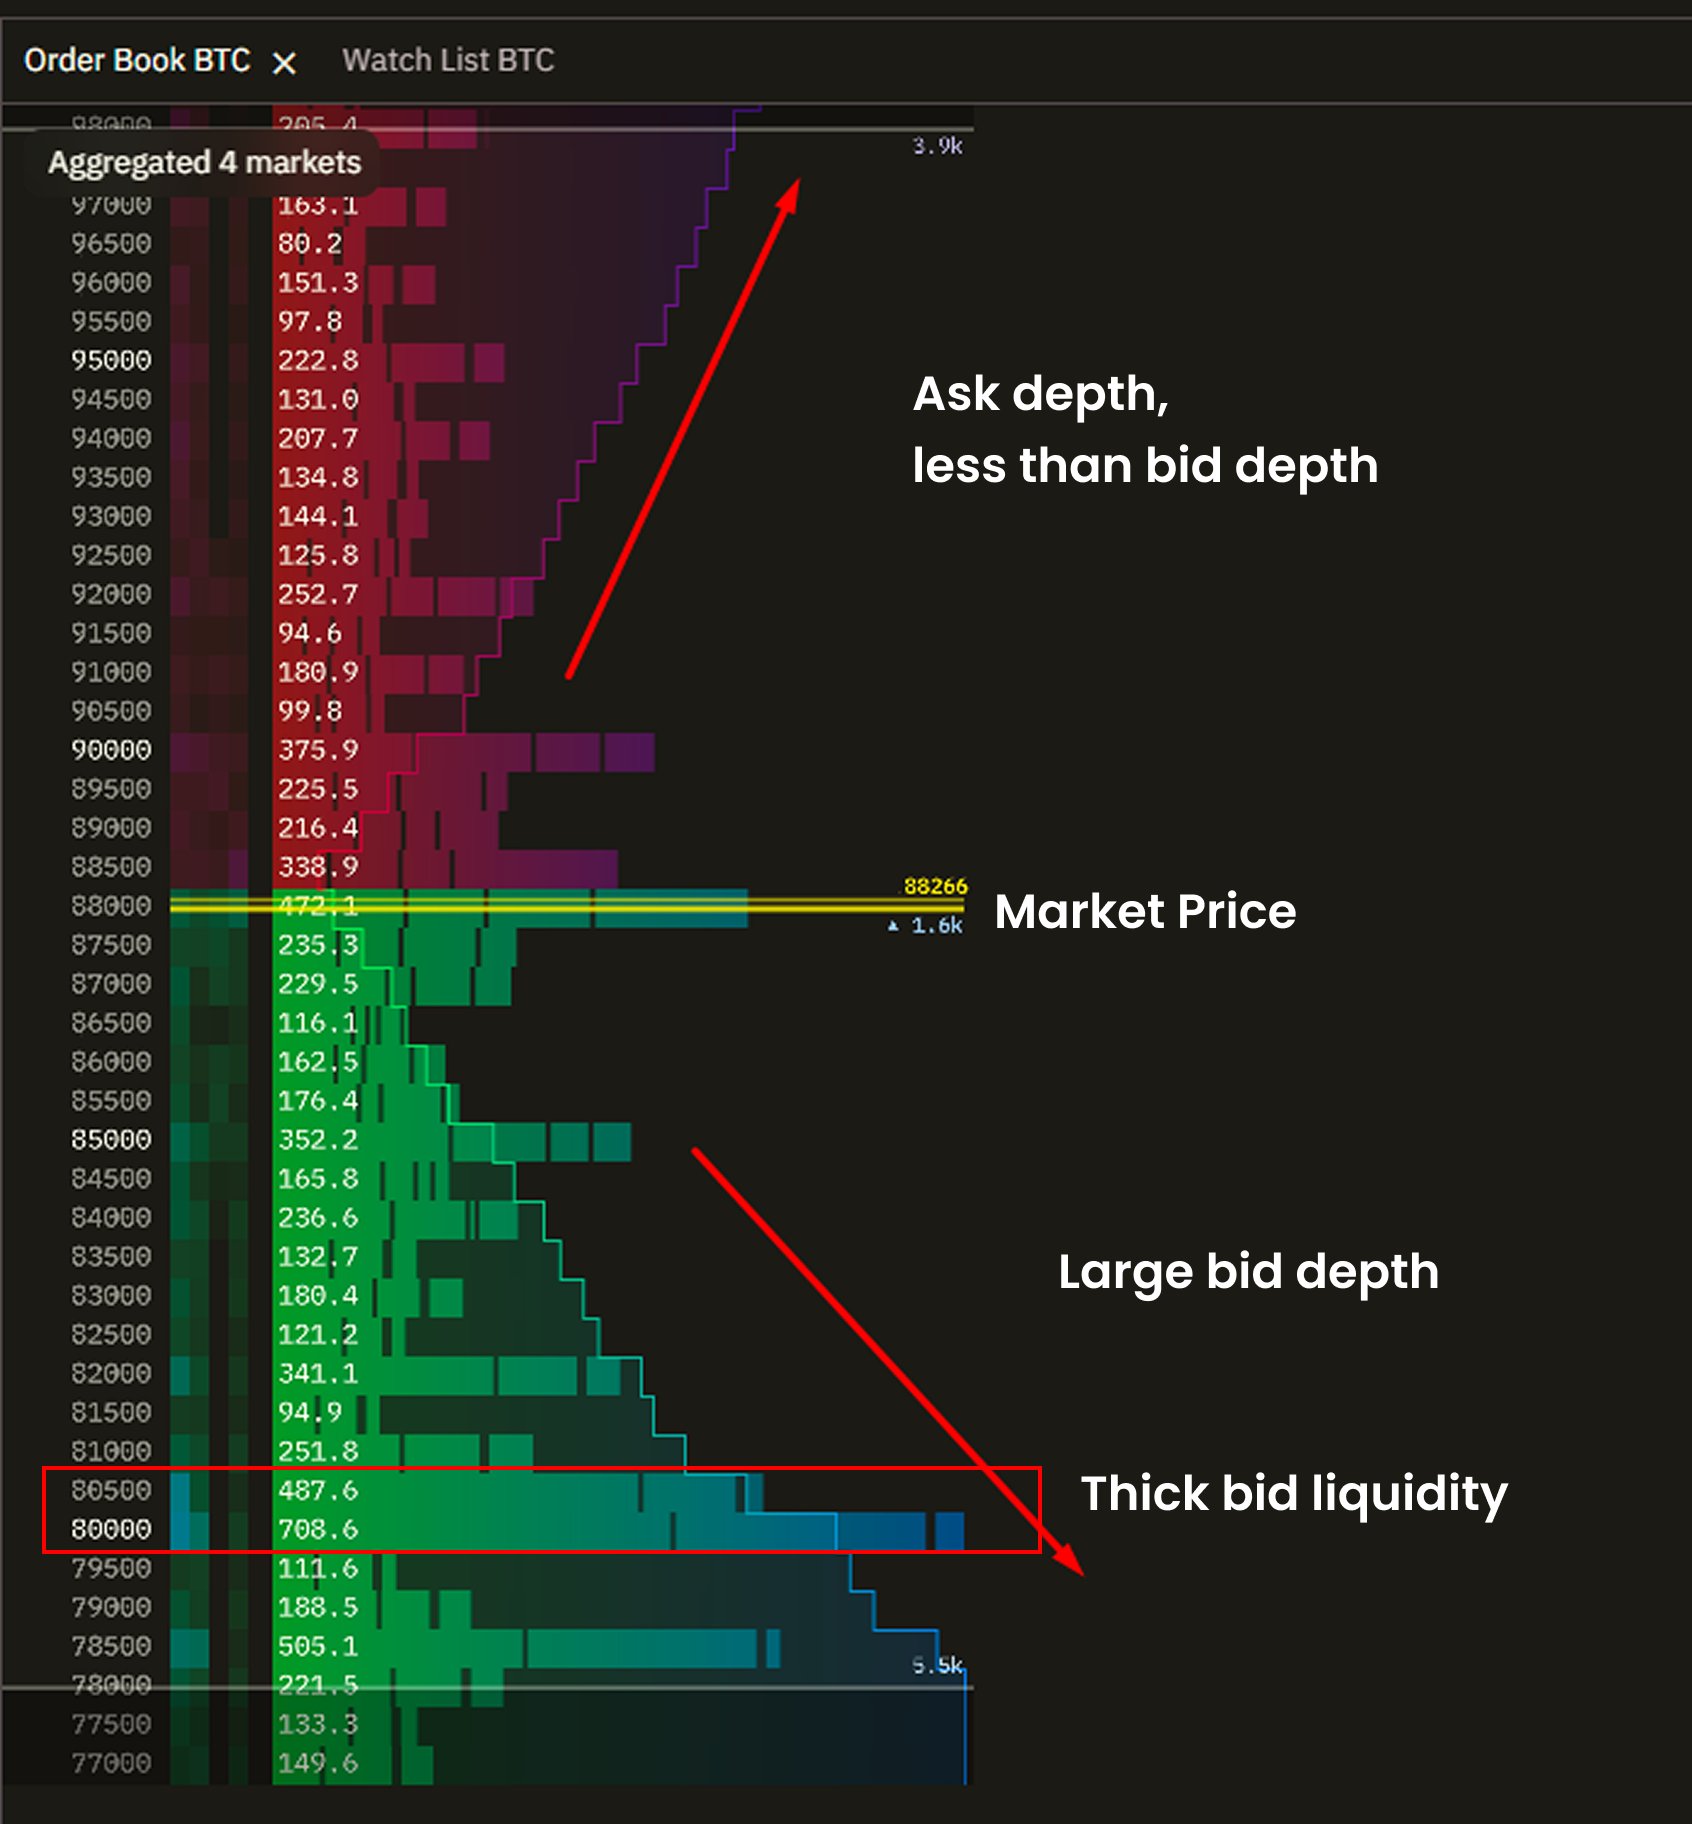
On the heatmap below, we can see a massive bid at a key level on Binance spot. Price repeatedly tests this zone but doesn’t even touch the wall, it bounces off wicks. This tells us the liquidity is strong: buyers are defending aggressively, absorbing selling pressure before price can reach the wall.
Eventually, the pressure becomes too much for shorts. They start closing positions and move price up.

What is "Depth"?
Depth = liquidity visible in the order book. Shows you how many resting buy/sell orders are stacked at various price levels.
What It Tells You:
Thick book = many orders = high liquidity = harder to move price.
Thin book = fewer orders = low liquidity = easier to move price.
You often hear “depth on the bid” (buy side) or “ask side is stacked.”
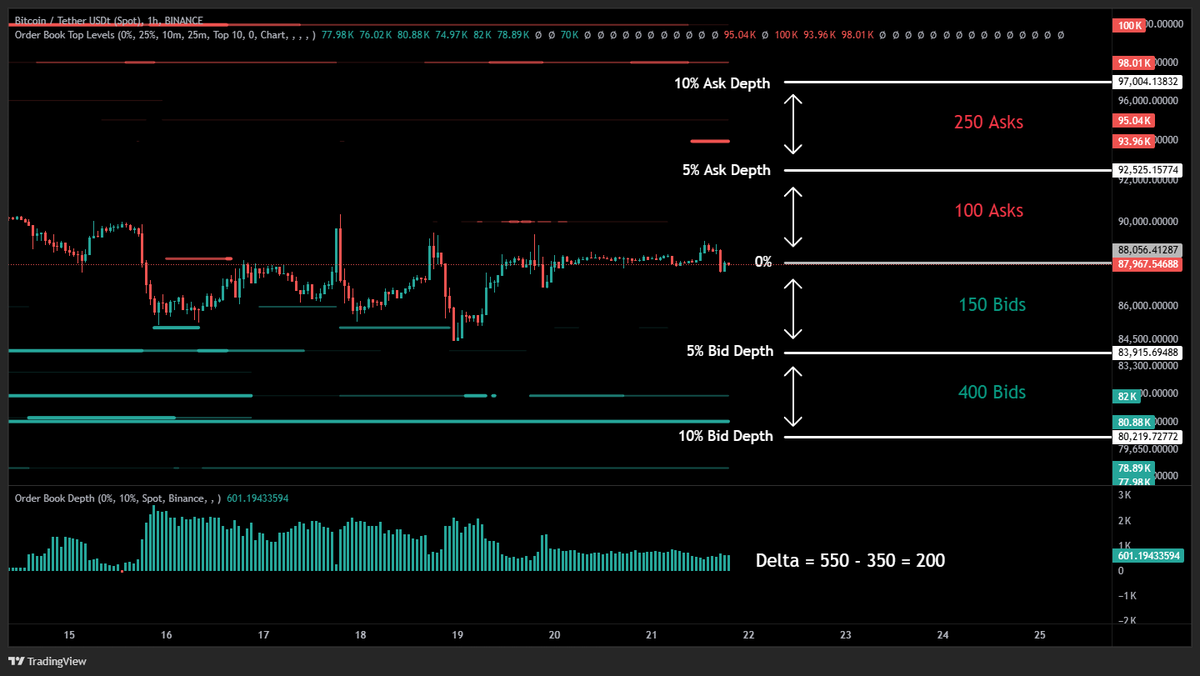
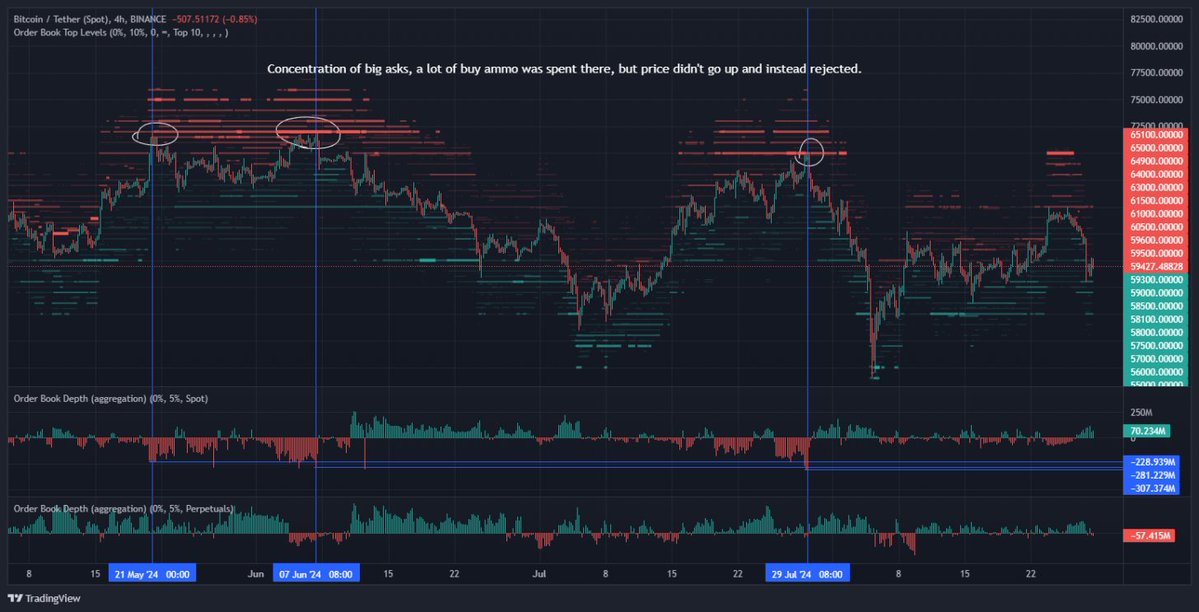
The screenshot below shows the aggregated order book + depth (liquidity) visualized on one screen. As we can see the depth curve above price is smaller, while the depth curve below price is much bigger. This means that we have less resistance compared to the bid side. It requires for market participants more sell ammo (market selling) to move price lower, but less buy ammo (market buying) to move price higher in this current example:
Many of you ask about the depth indicator with percentages that I often post and how depth delta is actually calculated.
Let’s break it down step by step with simple depth visualized on the price chart below, but first read the text.
Depth shows how much passive supply (asks) and passive demand (bids) exists within a percentage range from the current price.
Example:
Ask side
Within 0% – 5% ask depth → 100 asks
Within 5% – 10% ask depth → 250 asks
Total 0% – 10% ask depth → 100 + 250 = 350 asks
Bid side
Within 0% – 5% bid depth → 150 bids
Within 5% – 10% bid depth → 400 bids
Total 0% – 10% bid depth → 150 + 400 = 550 bids
The Order Book Depth indicator compares:
Passive demand (bids)
Passive supply (asks)
And displays the difference as delta bars:
Green = more bids than asks (positive delta)
Red = more asks than bids (negative delta)
You can choose the depth range in the settings.
In this example, the range is 0% – 10%.
Depth delta calculation:
550 bids − 350 asks = 200 depth delta
Meaning:
There are 200 more bids than asks within the selected depth range.
Keep in mind, orderbook depth delta doesn’t predict direction, it shows liquidity imbalance.
I use this indicator for spotting reversals in the BTC market, I prefer to use 25% depth as strong signal. On the charts below you can see times when significant orderbook imbalances paired with filtered out large limit orders marked tops and bottoms.
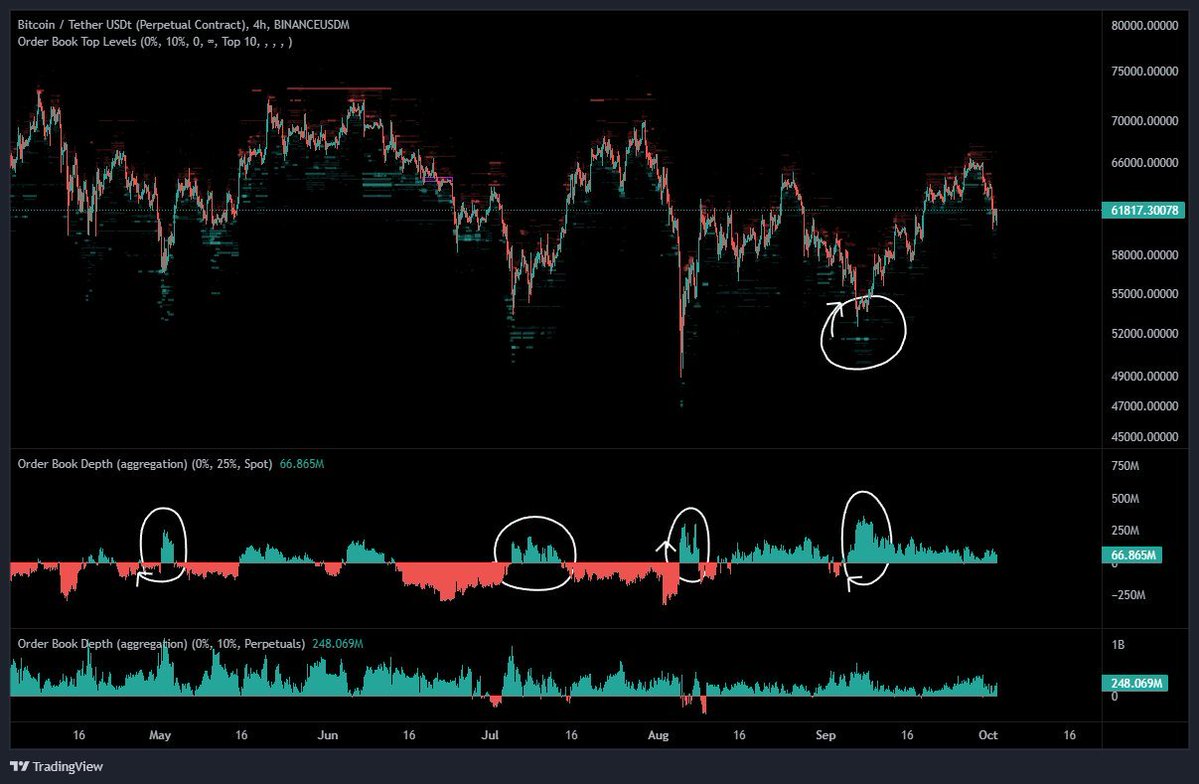
Keep in mind that order book depth is a lagging indicator. It reflects where liquidity is building, and the market often needs time to react.
When analyzing wider ranges (e.g. 25% depth), price may consolidate for weeks or even a month while large positive or negative depth delta develops.
For practical trading, I recommend using 2.5% and 5% depth for smaller ranges, and 10% depth for larger ranges. These settings are especially effective for range trading and spotting potential reversals, whether on an intraday or intra-week timeframe.
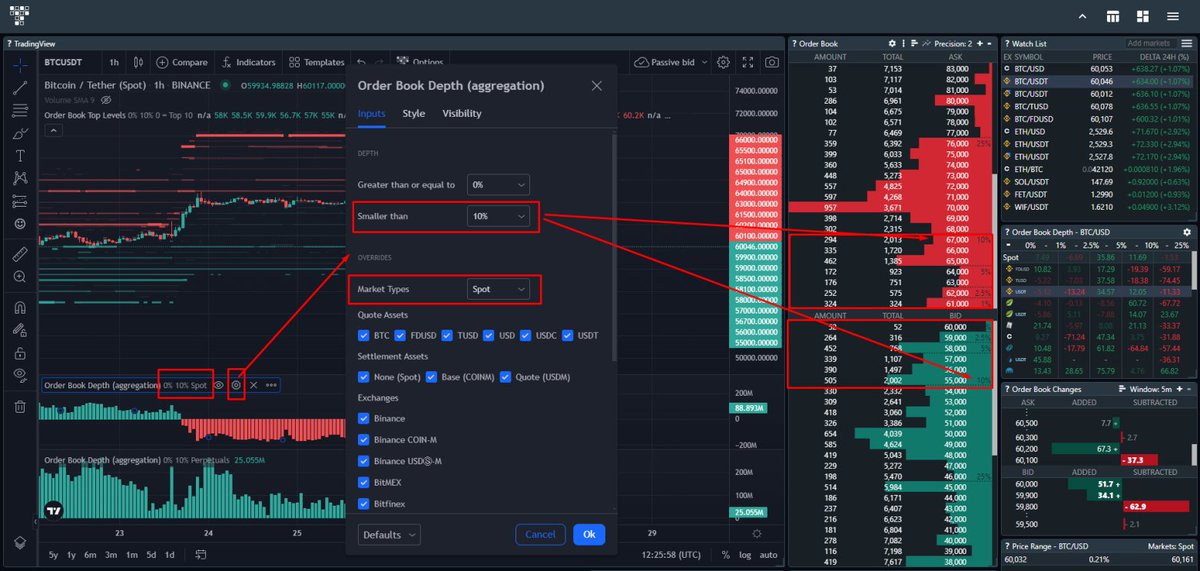
Here is a screenshot of Order Book Depth indicator settings on TRDR (link at the end of article) with simple additional explanation:
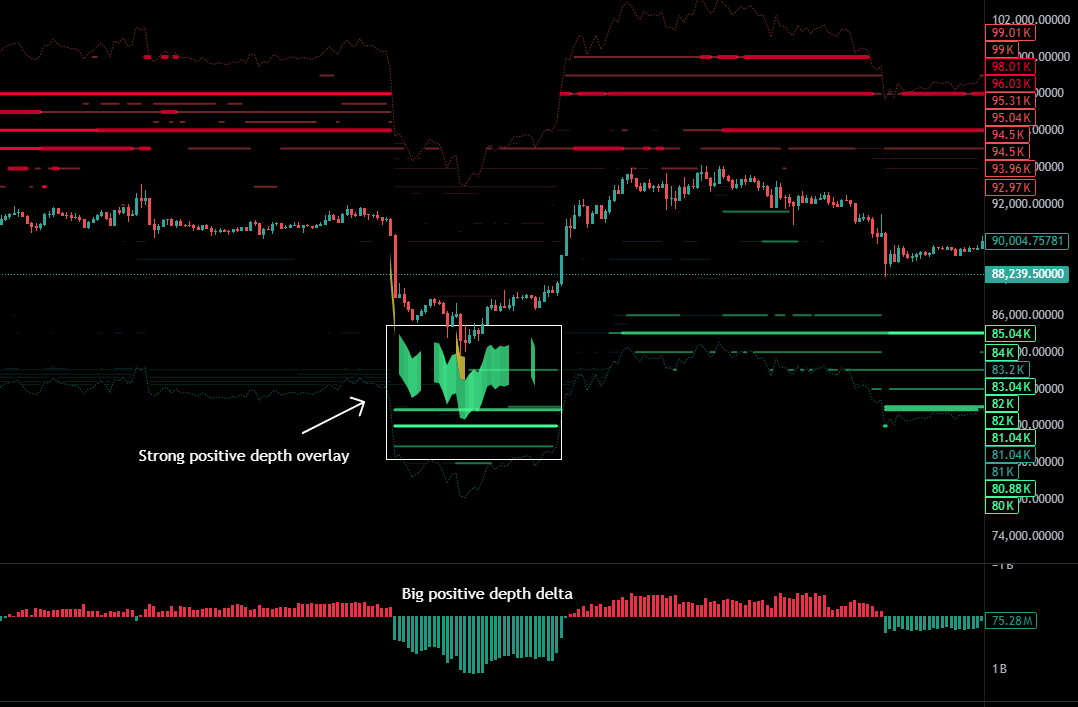
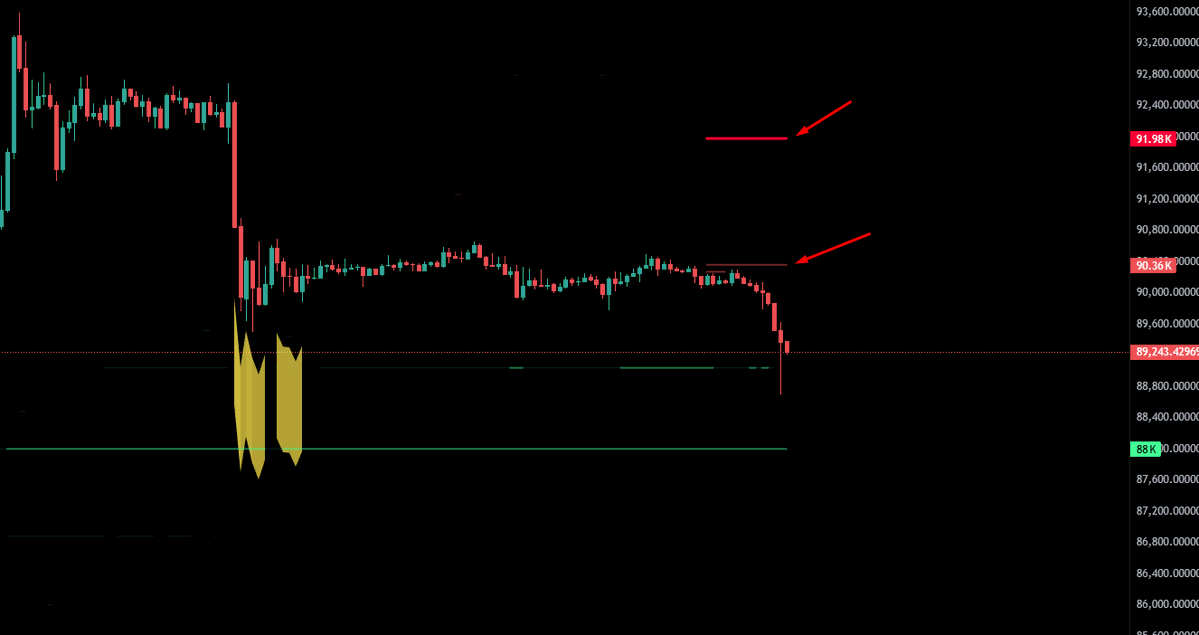
What is "Depth Overlay"?
The Order Book Depth Overlay is a chart indicator that takes the total volume of waiting limit orders (liquidity) and displays it directly around the current price candles. It measures the imbalance (Delta) between buy orders (Bids) and sell orders (Asks) within a specified percentage range. The result of calculation is plotted as dynamic colored bands:
Green Bands: Show heavy Buy Liquidity (potential support).
Red Bands: Show heavy Sell Liquidity (potential resistance).
It gives you a real-time, visual confirmation of where the big liquidity walls are, helping you confirm if a trend is supported or about to hit a major barrier. You can pair it with order book depth delta indicator and spot reversals, see example on the chart below:
Pro Tips
The Best Source: Focus on Spot Order Books. They reflect real money and offer a cleaner view of genuine supply and demand.
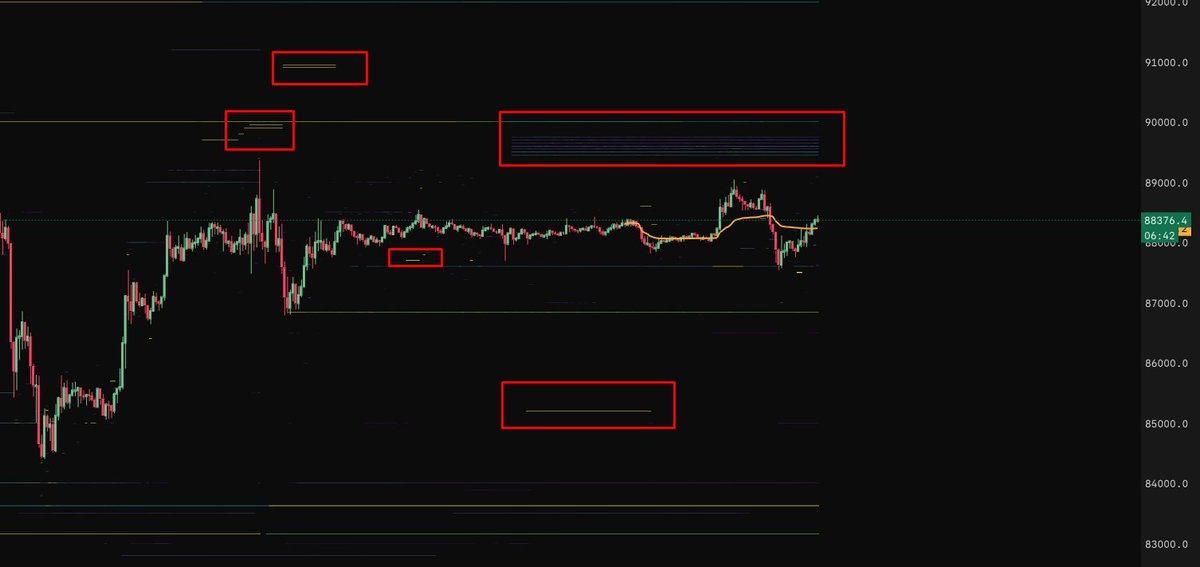
Avoid Perps: The Binance Perpetuals (Perps) order book heatmap is often a "mess." Massive orders with quantity above 1000 BTC are frequently placed and immediately canceled (spoofing) to manipulate the price. Do not rely on them. See the chart below as an example to get the idea visually:
When actively monitoring an order book heatmap, you’ll often spot tight consolidation followed by large limit orders suddenly appearing very close to the current price, almost as if they’re “chasing” it. This can be your signal to trade it accordingly. In the example below, we observe aggressive ask orders stacking up on Coinbase right above price. These fresh, big sell walls suppress upward movement, pressuring algos and retail traders to sell or short BTC. As a result, the price gets pushed lower, triggering a dump.
Here are websites where you can find and use all the tools shown and described in this article:
TRDR - https://trdr.io/r/880199fd90e3e954ab3deb1a00f42643
MMT - https://marketmonkeyterminal.com/?atp=exitpump
Kiyotaka - https://kiyotaka.ai/
TapeSurf - https://tapesurf.com/app?dashboard=xXKYGqdzWzknX009Dzzn
The order book is the purest form of supply and demand, and by combining the three tools we covered - Depth, Heatmap, and Overlay - you gain a 3D view of the market. I hope this guide helps you make sense of Order Books and add another powerful weapon to your trading toolkit.
 Source
 Add to Favorites
 Download image
 Share x
 Copy link
Bitcoin may enter a prolonged sideways phase between $57K and $87K as markets enter a relief period following a 52% drop from ATH. This consolidation could mirror the 2022 fractal, creating liquidity before a potential breakdown toward the $44K–$50K range.
Doctor Profit/2026.03.09

Davinci Jeremie urged people to buy $1 of Bitcoin in 2013 and became a symbol of early conviction. Years later, fame, lifestyle flexing, and token promotions sparked criticism. His journey reflects both crypto foresight and influencer-era controversy.
StarPlatinum/2026.03.04
A sweeping narrative ties Jane Street to India’s expiry-day options case, alleged 10AM Bitcoin sell patterns, Terra’s collapse, and ETF plumbing. While none prove misconduct, critics argue a common structure: move spot, monetize derivatives, keep execution opaque.
Bull Theory/2026.02.27
A controversial narrative links Jane Street, ETF mechanics, and Bitcoin’s price behavior, pointing to lawsuit allegations, 10AM volatility patterns, and derivative hedging dynamics. The discussion raises broader questions about liquidity, structure, and price discovery.
Justin Bechler/2026.02.26
A new federal lawsuit alleges Jane Street exploited non-public information tied to Terraform’s liquidity defenses, accelerating UST’s depeg and the Terra collapse. The firm denies the claims. The case may reignite debates on structure, design, and regulation.
Diana/2026.02.25
Mean reversion and on-chain models sit at levels historically linked to bottom formation after capitulation. Realized losses reached record USD values, while deviations from anchor models remain extreme. Price pain may be fading; patience remains key.
Checkmate/2026.02.25
Hot feeds
A trader profits $448K by monitoring #Binance's new listings!
2024.12.13 17:37:29
Last week, funds have flowed into #Bitcoin, #Ethereum, and #Hyperliquid.
2024.12.16 14:48:36
A $PEPE whale that had been dormant for 600 days transferred all 2.1T $PEPE($52M) to a new address.
2024.12.14 10:35:27
When Elon Musk tweeted about Moltbook, the meme coin MOLT experienced a short-term 30% price surge, hitting a new all-time high of $114 million.
2026.01.31 18:37:29
A smart #AI coin trader made $17.6M on $GOAT, $ai16z, $Fartcoin,$arc.
2025.01.05 16:05:18
A sniper earned 2,277 $ETH ($8.3M) trading $SHIRO within 18 hours!
2024.12.03 23:09:08
MoreHot Articles
How did I turn $1,000 into $30,000 with smart money?
2024.12.09
10 promising AI Agent cryptos
2024.12.05
The 30-Year-Old Entrepreneur Behind Virtual, a Multi-Million Dollar AI Agent Society
2025.01.22
10 smart traders specializing in MEMEcoin trading on Solana
2024.12.09
A trader lost $73.9K trading memecoins in just 3 minutes — a lesson for us all!
2024.12.13
What is $SPORE? Let us take you through the on-chain records to show you how it works.
2024.12.25

