
 App Store
 Profile
 Security
 Sign Out
 Feeds
Feeds
 Articles
On-Chain Basics Explained: How to Read Crypto Metrics Like a Trader
On-Chain Basics: What These Metrics Actually Mean

On-chain metrics are the stuff everyone tweets about but almost nobody actually understands. Here's a simple guide to what they really mean and how to use them as a trader.
Welcome back to Explained Series #3
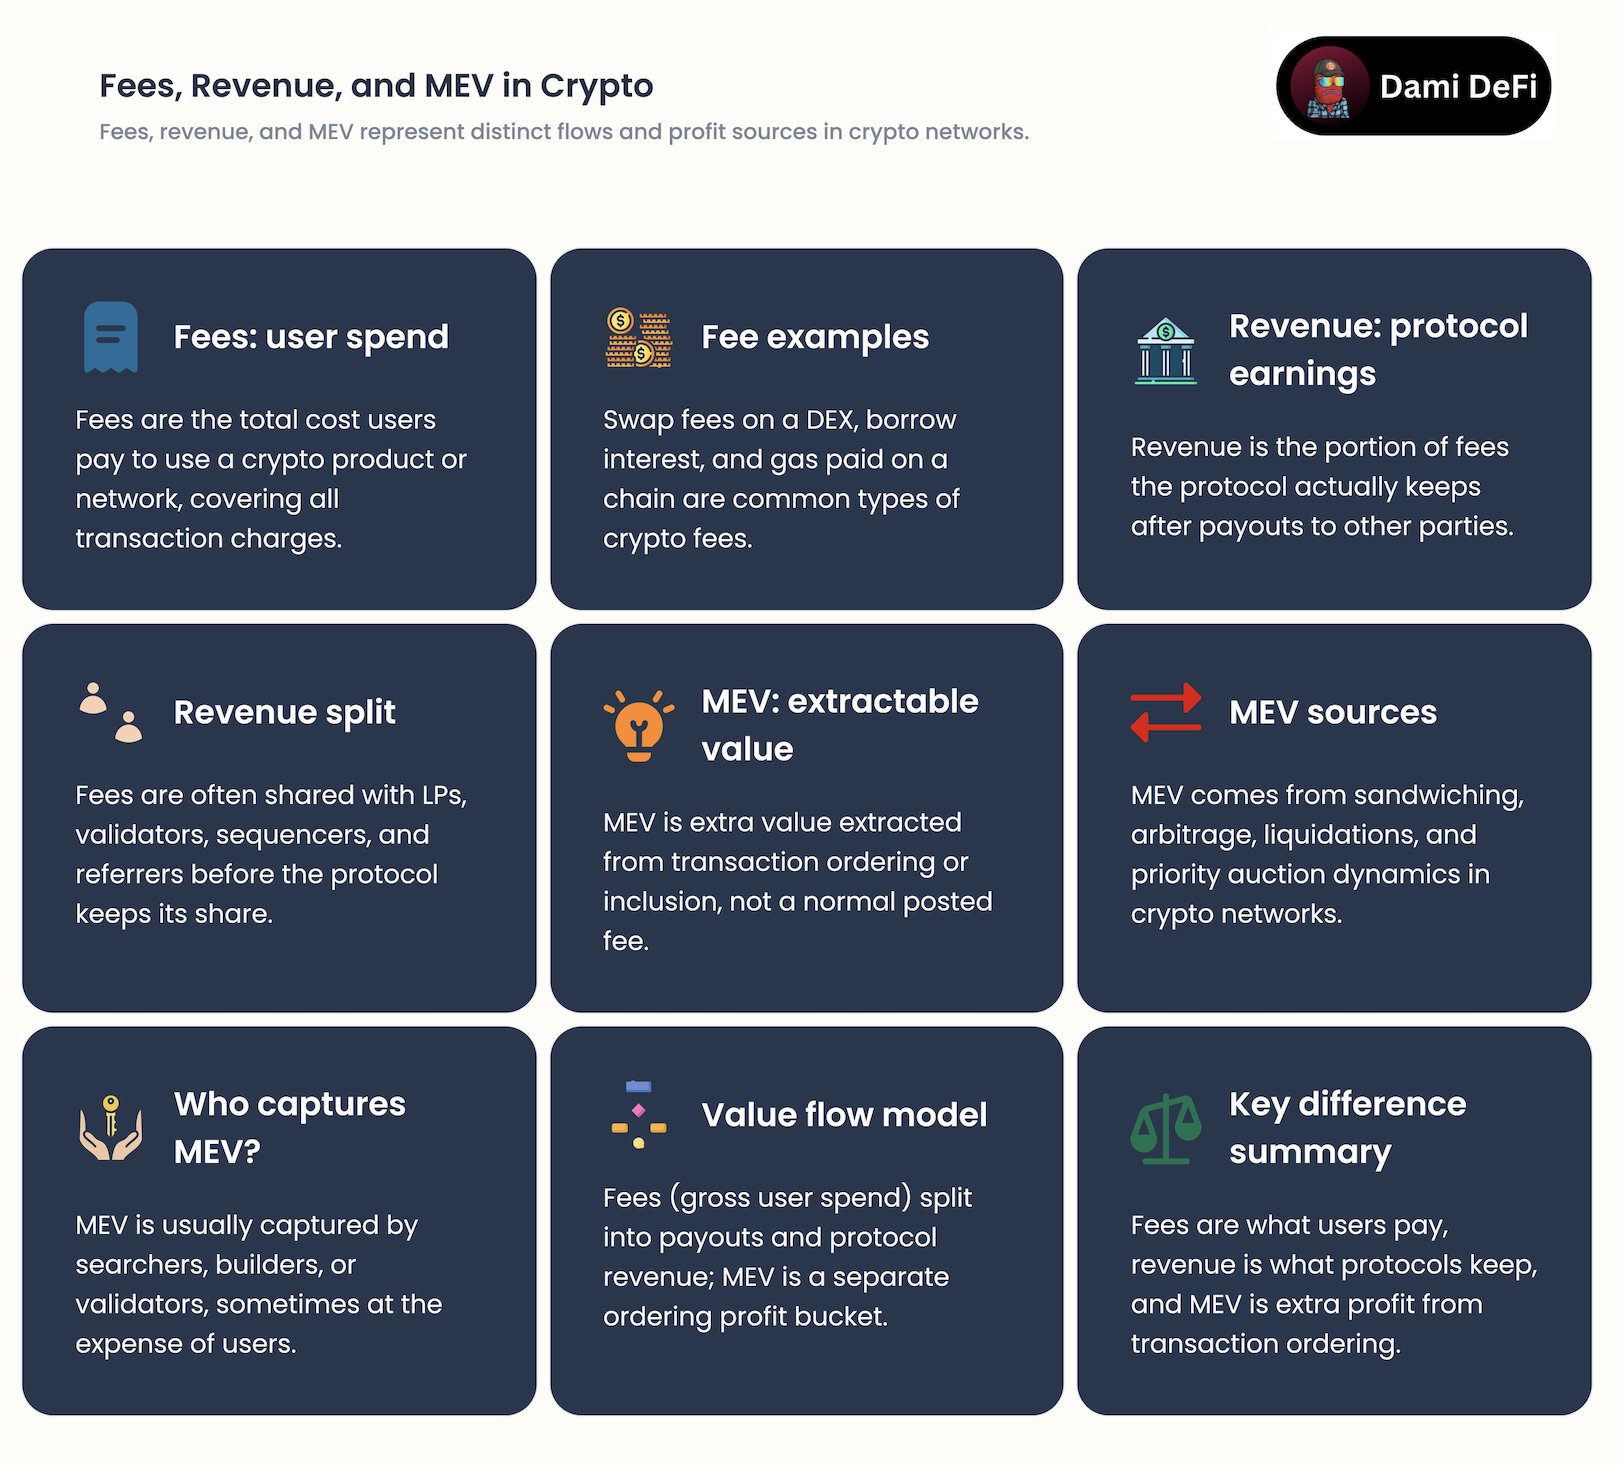
1. Fees vs Revenue vs MEV: What Chains Actually Earn
Let's get the basics straight. Fees are what users pay to transact. Revenue is what the protocol or validators actually keep. MEV (Maximal Extractable Value) is the extra profit validators earn by strategically ordering transactions.
Here's the thing: high fees don't automatically mean a chain is winning. You want sustainable revenue, not just expensive transactions that drive users away. A chain bleeding users because of $50 swap fees isn't building anything durable.
Trader angle: Focus on chains with growing real revenue plus reasonable tokenomics. Pure MEV-dependent models are fragile. When the volume dries up or competition arrives, the party ends fast.
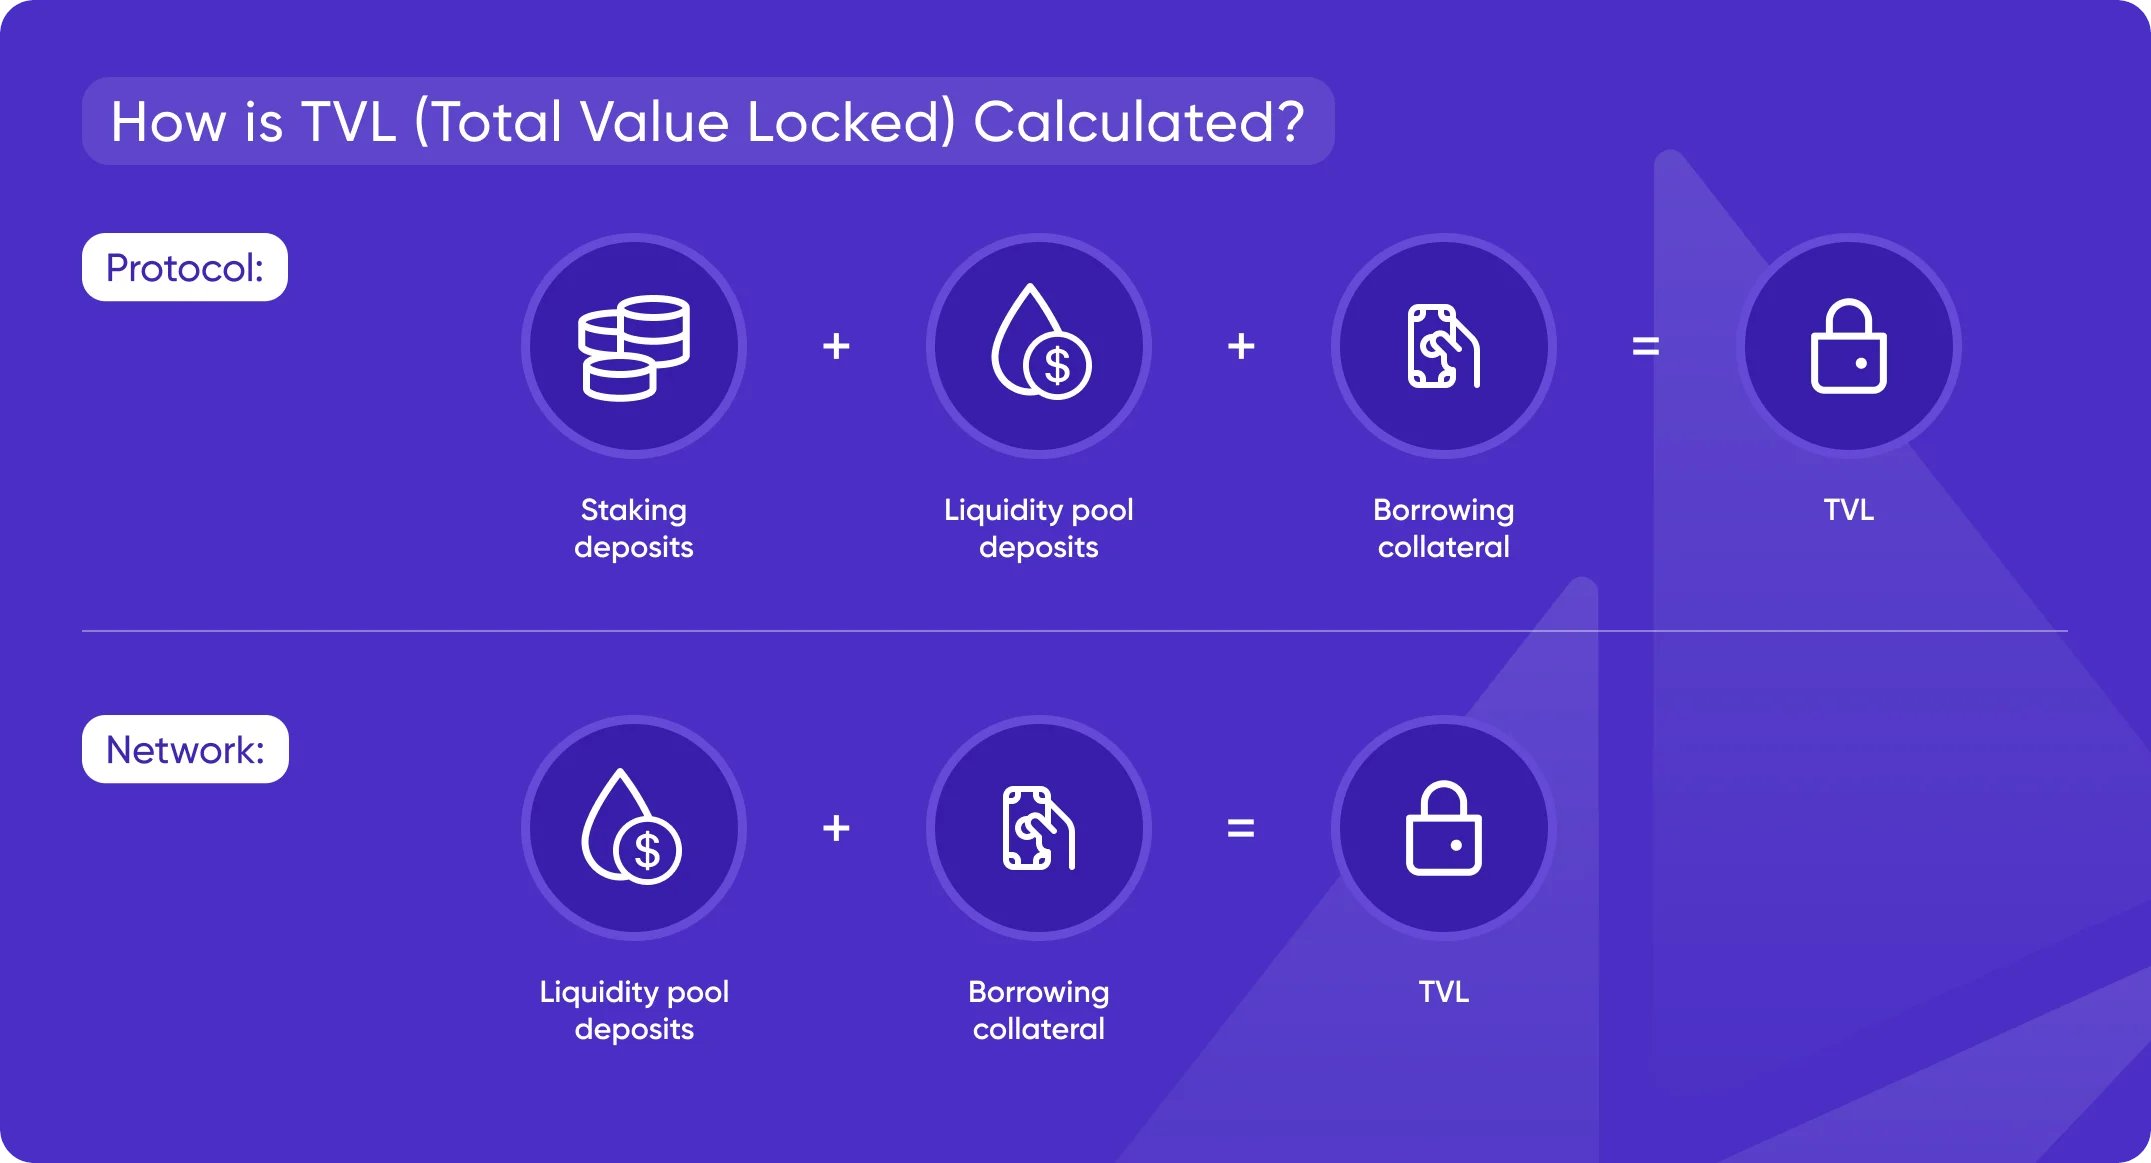
2. TVL (and 3 Ways It Lies)
Total Value Locked is the total capital parked in a protocol or chain. It shows how much money trusts the system right now, which sounds useful until you realize how easily it misleads.
Three ways TVL lies to you:
Double-counting: The same money gets rehypothecated across multiple protocols, inflating the numbers.
Bribed TVL: Short-term incentives attract mercenary capital that vanishes the moment rewards dry up.
Dead stablecoins: Billions sitting idle in wallets, counted as TVL but never actually used.
Trader angle: Never judge a protocol on TVL alone. Look at TVL alongside volume and incentive schedules. Real usage beats vanity metrics.
3. DAA / Active Addresses: Real Users or Just Noise?
Daily Active Addresses (DAA) counts how many addresses did something on-chain. Sounds like a proxy for real users, except it can faked.
Bots run wild. Airdrop farmers create thousands of addresses. Protocols shuffle tokens internally to pump numbers. An address doing one transaction could be anything from a genuine user to automated noise.
DAA matters when it moves with fees, volume, and genuine activity. If addresses spike but revenue stays flat, you're looking at manufactured metrics.
Trader angle: Treat DAA as a confirmation signal, never as your primary buy thesis. It validates growth when other fundamentals support it.
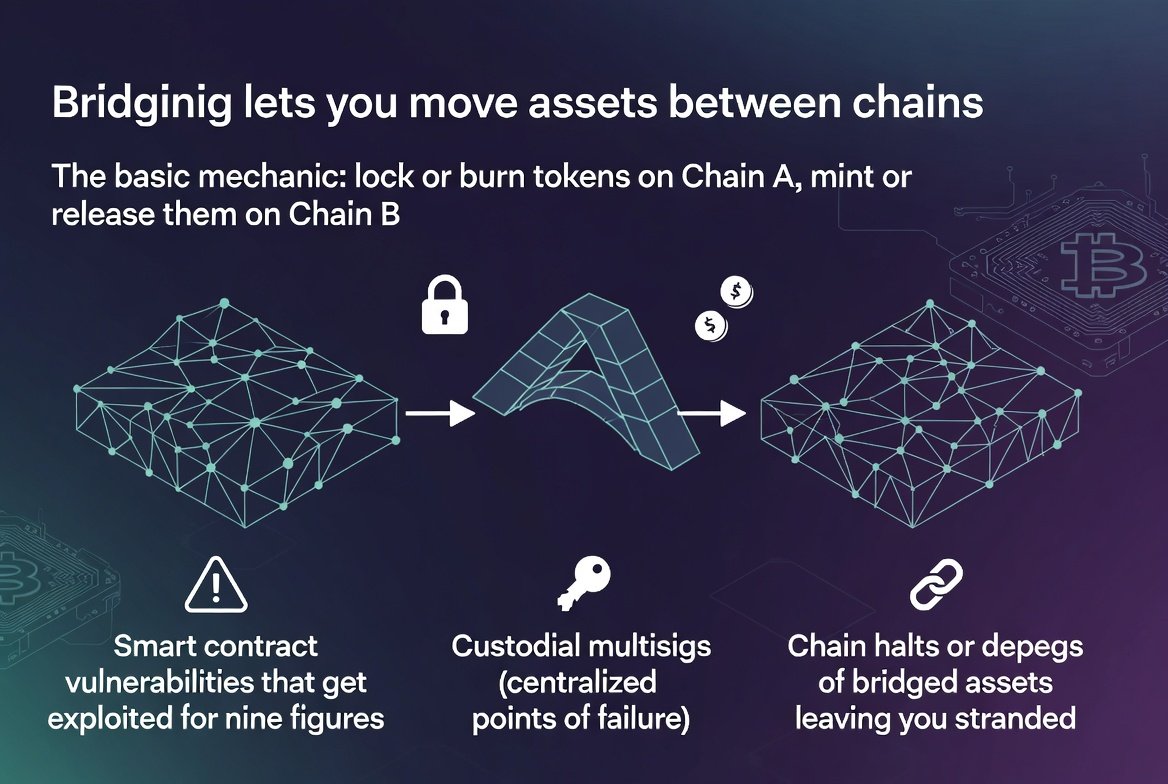
4. Bridges: How Money Hops Chains (and Where It Breaks)
Bridging lets you move assets between chains. The basic mechanic: lock or burn tokens on Chain A, mint or release them on Chain B. Simple concept, complex risks.
Main bridge risks include:
Smart contract vulnerabilities that get exploited for nine figures
Custodial multisigs (centralized points of failure)
Chain halts or depegs of bridged assets leaving you stranded
Trader angle: Don't park significant capital on risky bridges long-term. But do watch bridge volumes for narrative signals. When money flows from Ethereum to an L2, or from one ecosystem to another, that's liquidity migration you can trade.
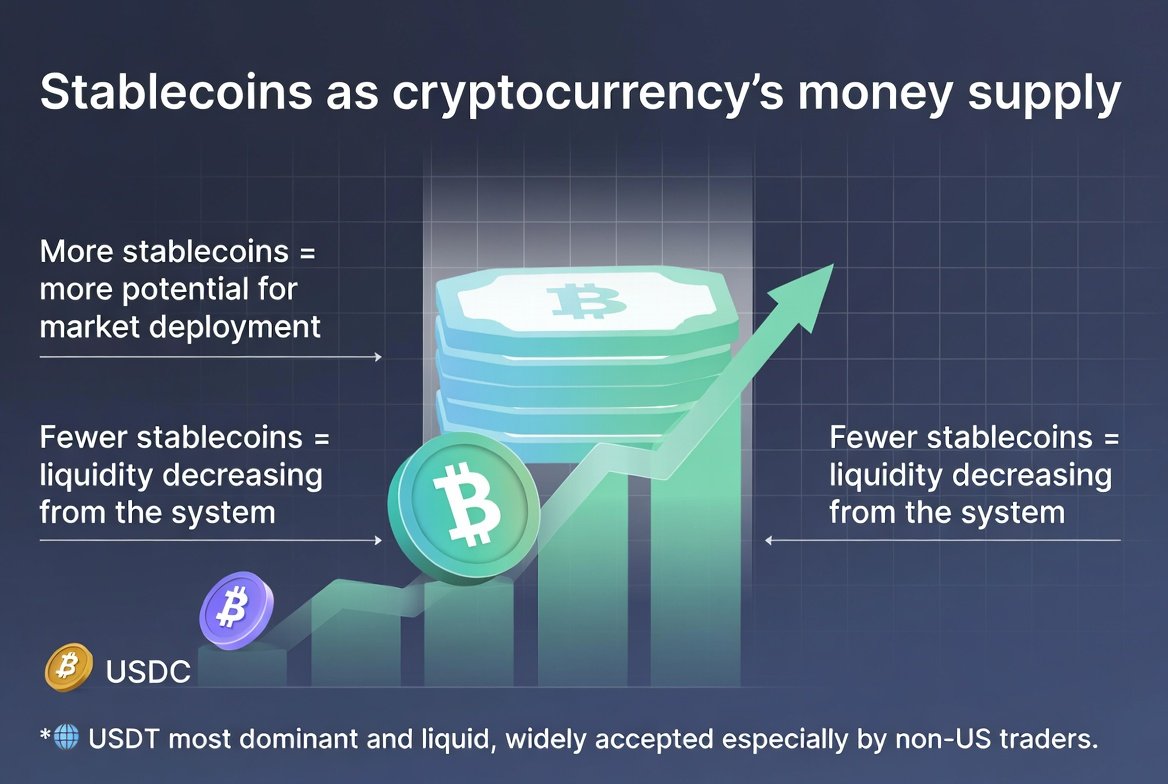
5. Stablecoins: Crypto's M2
Stablecoin supply is basically crypto's money supply. More stablecoins mean more dry powder waiting to deploy. Less means liquidity is leaving the system.
USDT dominates because it's the most liquid and widely accepted, especially for non-US traders. USDC is cleaner but less ubiquitous. When total stablecoin supply trends up, it typically supports larger market moves.
When it collapses, that's your warning sign.
Trader angle: Rising stablecoin supply usually supports bigger trends. Collapsing supply means tightening liquidity, which kills rallies. Watch this metric for macro positioning.
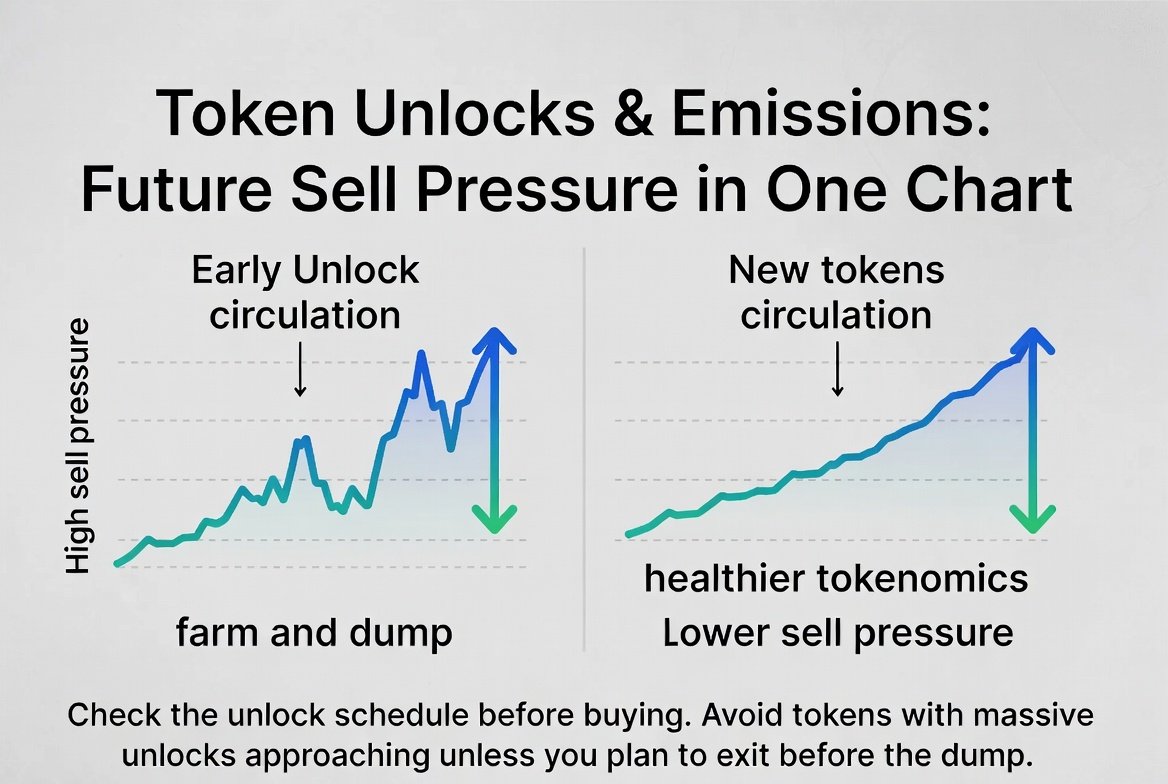
6. Token Unlocks & Emissions: Future Sell Pressure in One Chart
Unlocks and emissions represent new tokens entering circulation. Big unlocks mean automatic sellers: teams cashing out, VCs dumping, or reward programs flooding supply.
Simple rules: Steep early unlock schedules scream "farm and dump." Long, smooth unlocks paired with real demand suggest healthier tokenomics.
Trader angle: Always check the unlock schedule before buying anything. Avoid tokens with massive unlocks approaching unless you're trading short-term and plan to exit before the dump.
7. On-Chain Volume vs TVL: Is This Pool Dead or Actually Used?
TVL tells you what's parked. Volume tells you what's moving. A pool with $100M TVL but $5K daily volume is dead capital.
The Volume-to-TVL ratio matters. High ratio means active, productive capital. Low ratio means ghost liquidity: mercenary farmers waiting for the next incentive or just dead money going nowhere.
Trader angle: Target protocols with solid TVL and strong volume. You want actual usage, not zombie liquidity pretending to be traction.
On-chain metrics aren't magic, but they're the closest thing we have to financial statements in crypto. Use them as tools, not gospel. Cross-reference multiple signals, and always question what you're actually measuring.
 Source
 Add to Favorites
 Download image
 Share x
 Copy link
Bitcoin may enter a prolonged sideways phase between $57K and $87K as markets enter a relief period following a 52% drop from ATH. This consolidation could mirror the 2022 fractal, creating liquidity before a potential breakdown toward the $44K–$50K range.
Doctor Profit/2026.03.09

Davinci Jeremie urged people to buy $1 of Bitcoin in 2013 and became a symbol of early conviction. Years later, fame, lifestyle flexing, and token promotions sparked criticism. His journey reflects both crypto foresight and influencer-era controversy.
StarPlatinum/2026.03.04
A sweeping narrative ties Jane Street to India’s expiry-day options case, alleged 10AM Bitcoin sell patterns, Terra’s collapse, and ETF plumbing. While none prove misconduct, critics argue a common structure: move spot, monetize derivatives, keep execution opaque.
Bull Theory/2026.02.27
A controversial narrative links Jane Street, ETF mechanics, and Bitcoin’s price behavior, pointing to lawsuit allegations, 10AM volatility patterns, and derivative hedging dynamics. The discussion raises broader questions about liquidity, structure, and price discovery.
Justin Bechler/2026.02.26
A new federal lawsuit alleges Jane Street exploited non-public information tied to Terraform’s liquidity defenses, accelerating UST’s depeg and the Terra collapse. The firm denies the claims. The case may reignite debates on structure, design, and regulation.
Diana/2026.02.25
Mean reversion and on-chain models sit at levels historically linked to bottom formation after capitulation. Realized losses reached record USD values, while deviations from anchor models remain extreme. Price pain may be fading; patience remains key.
Checkmate/2026.02.25
Hot feeds
A trader profits $448K by monitoring #Binance's new listings!
2024.12.13 17:37:29
Last week, funds have flowed into #Bitcoin, #Ethereum, and #Hyperliquid.
2024.12.16 14:48:36
A $PEPE whale that had been dormant for 600 days transferred all 2.1T $PEPE($52M) to a new address.
2024.12.14 10:35:27
When Elon Musk tweeted about Moltbook, the meme coin MOLT experienced a short-term 30% price surge, hitting a new all-time high of $114 million.
2026.01.31 18:37:29
A smart #AI coin trader made $17.6M on $GOAT, $ai16z, $Fartcoin,$arc.
2025.01.05 16:05:18
A sniper earned 2,277 $ETH ($8.3M) trading $SHIRO within 18 hours!
2024.12.03 23:09:08
MoreHot Articles
How did I turn $1,000 into $30,000 with smart money?
2024.12.09
10 promising AI Agent cryptos
2024.12.05
The 30-Year-Old Entrepreneur Behind Virtual, a Multi-Million Dollar AI Agent Society
2025.01.22
10 smart traders specializing in MEMEcoin trading on Solana
2024.12.09
A trader lost $73.9K trading memecoins in just 3 minutes — a lesson for us all!
2024.12.13
What is $SPORE? Let us take you through the on-chain records to show you how it works.
2024.12.25

