
 App Store
 Profile
 Security
 Sign Out
 Feeds
Feeds
 Articles
Gold’s 5-Sigma Crash: Inside the Largest Single-Day Drop Since 2013
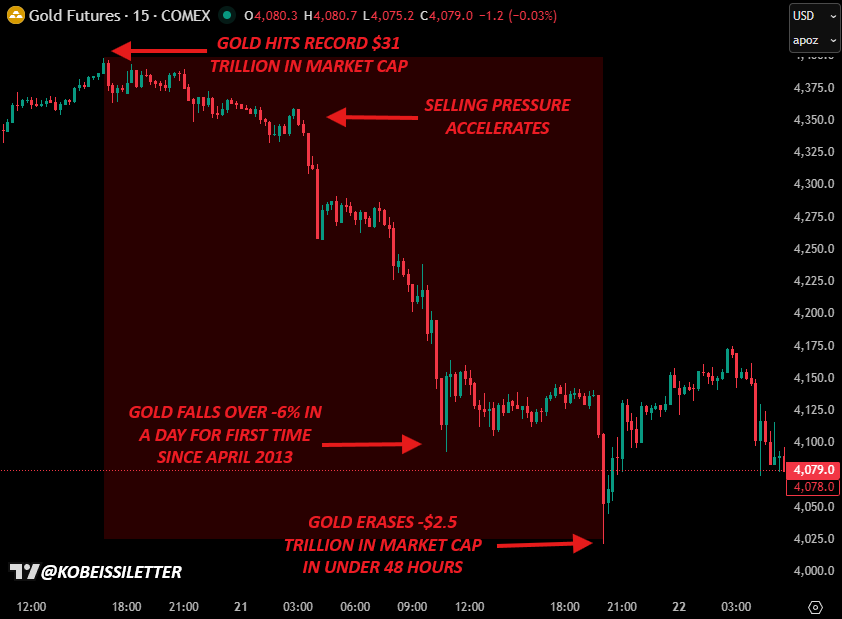
We just witnessed history:
Yesterday, gold prices fell -5.7%, marking the largest 1-day drop since April 2013.
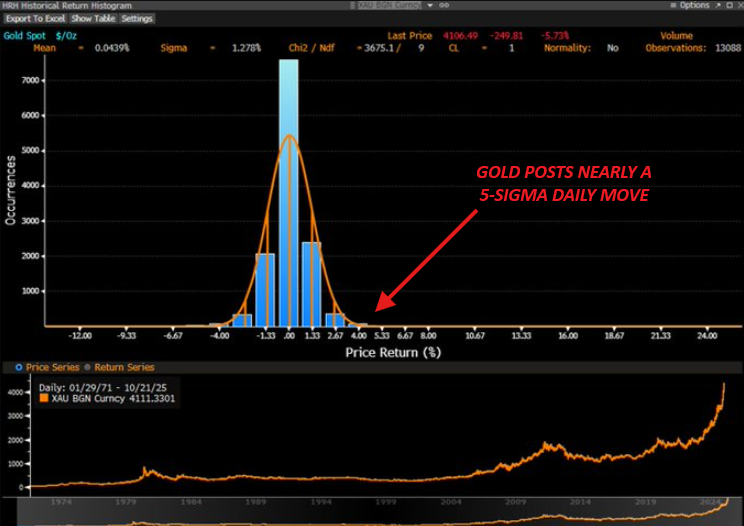
This is a ~4.5 sigma move.
In other words, such a large move only happens in 1 out of 240,000 days in a "normal" world.
What does it mean? Let us explain.
Statistically speaking, gold's move was a near 5-sigma event.
However, in reality, gold has seen a move of this magnitude only 34 times since 1971.
In other words, this occurs in 34 of 13,088 trading days or 0.26% of the time, per @BurggrabenH.
This is EXTREMELY rare.
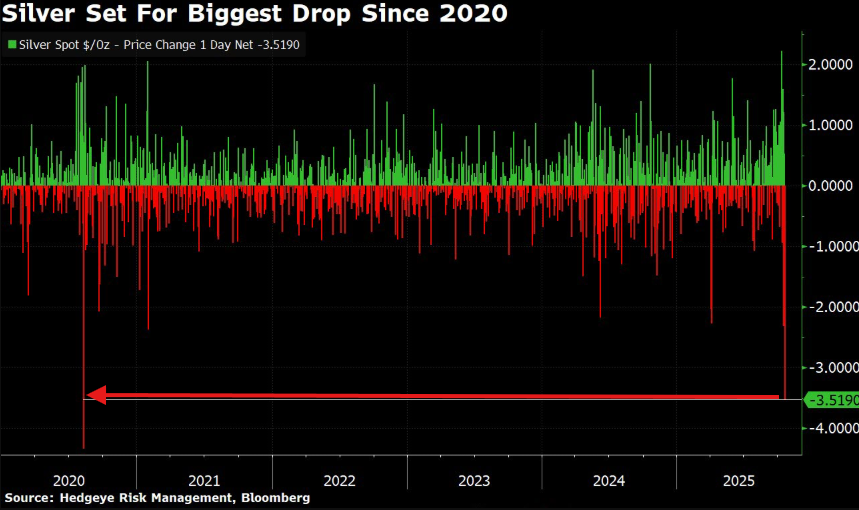
Silver prices were hit even harder.
Silver fell as much as -9% in a single-day and posted its largest daily decline since the 2020 crash.
Gold and silver neared -$3 trillion in lost market cap in just over 24 hours of trade.
But, we cannot ignore what happened BEFORE this.
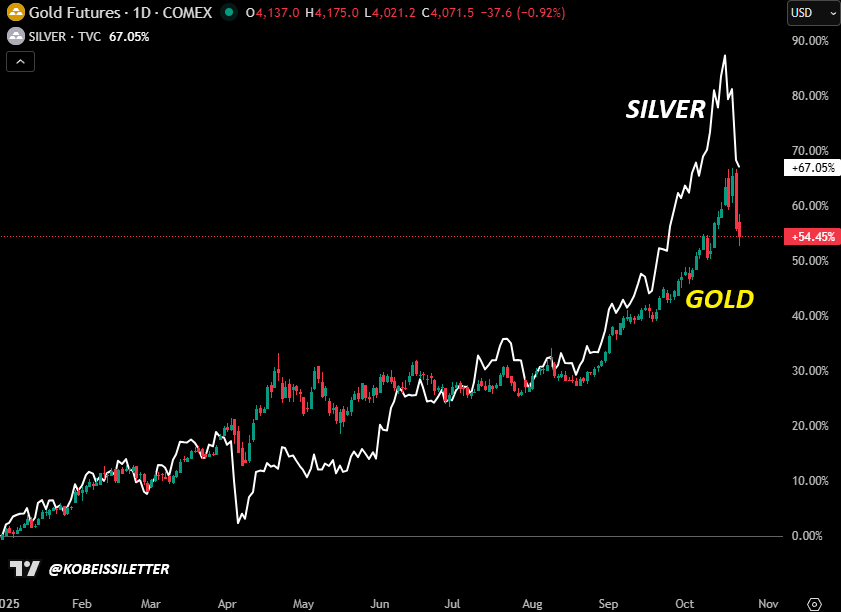
Before yesterday's crash, gold and silver posted their best rally in over 40 years.
Silver was up as much as +85% YTD and Gold was nearing +70% YTD returns.
Still, Silver and Gold are up +67% and +55% respectively, more than 4 TIMES the S&P 500's return.
A drop was overdue.
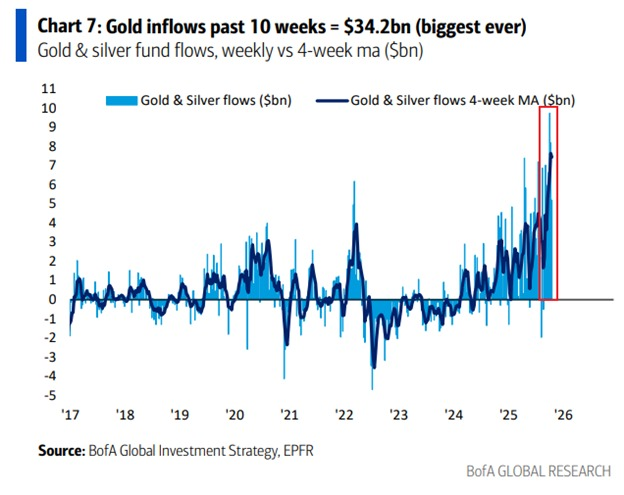
Flows were a CLEAR leading indicator that this drop was coming.
In the week ending October 10th, gold and silver funds posted +$8.2 billion in net inflows, the 2nd-largest inflow on record.
This followed a record +$9.5 billion seen in the prior week.
The trade was crowded.
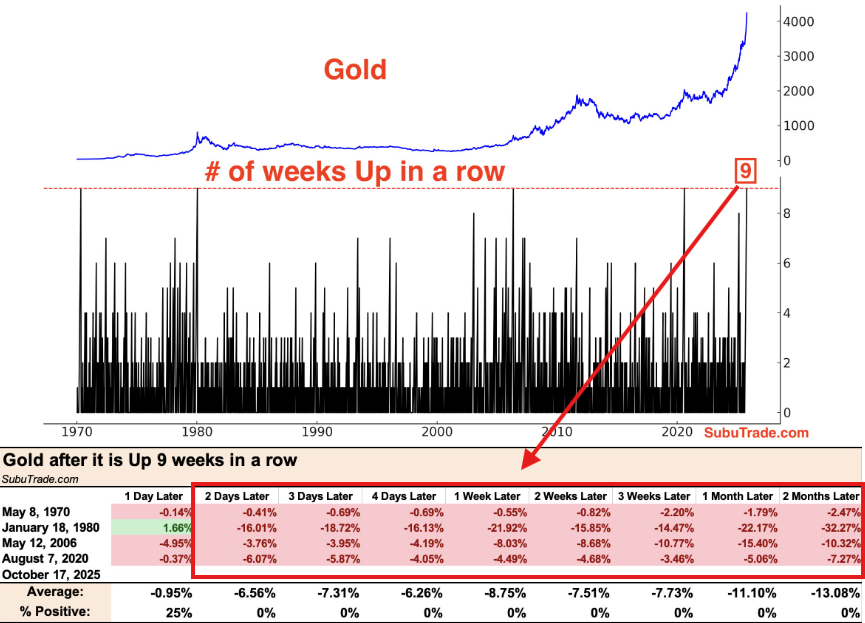
Meanwhile, gold was up for 9-STRAIGHT weeks for the 5th time in history.
Gold has never posted 10-straight weekly gains.
In the previous 4 times this happened, gold ended an average of -13% lower 2 months later.
So, what's next after the first blow to a historic run?
In our view, gold remains fundamentally strong.
In fact, it has only improved over the last few days.
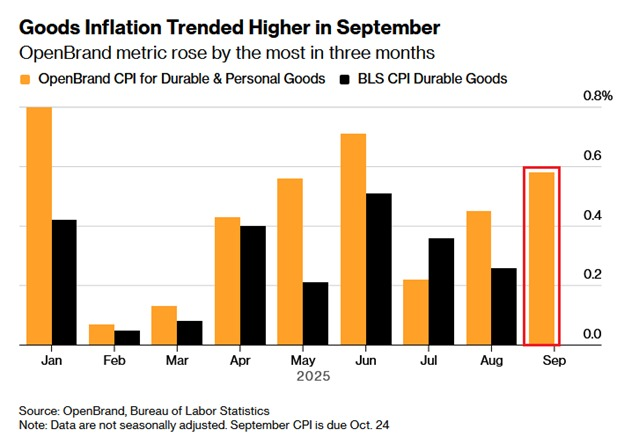
Amid the government data blackout, alternative metrics show US inflation at 2.6%.
This marks the 5th-consecutive monthly increase in these alternative metrics.
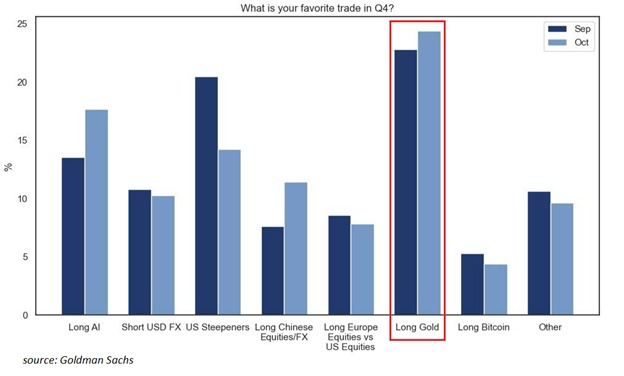
Meanwhile, institutional capital is still piling into the commodity.
~25% of investors surveyed by Goldman say their favorite trade is “long gold,” the highest reading for the 2nd consecutive month.
This is HIGHER than “long AI” stocks, which stands at ~18% of respondents.
On top of this, central banks are stocking up on gold while disregarding technicals.
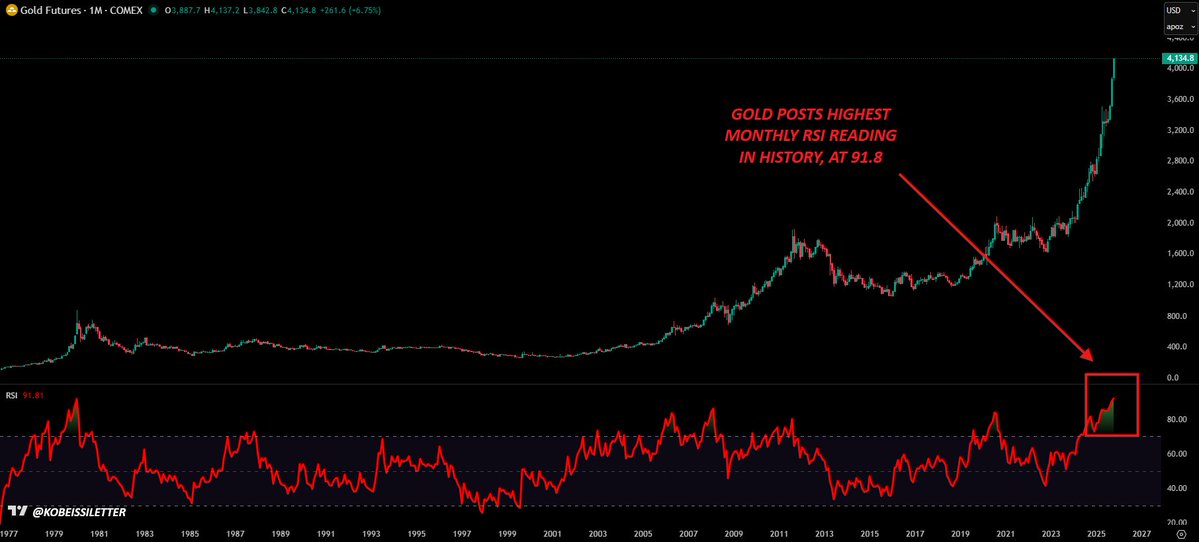
On October 13th, gold posted its highest monthly RSI reading in HISTORY, at 91.8.
Physical gold demand this year has proven that buyers are ignoring technicals.
We don't see this changing.
All of this is happening as the US simply keeps on printing money.
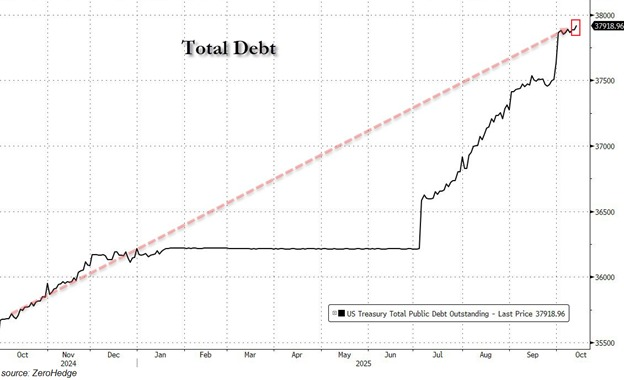
By as soon as Friday, total US debt is set to cross above $38 TRILLION for the first time in history.
This marks a +$400 BILLION jump this month, or +$25 billion per day.
Gold knows exactly what this means.
Gold's price drivers are having widespread implications on markets.
The macroeconomy is shifting and stocks, commodities, bonds, and crypto are investable.
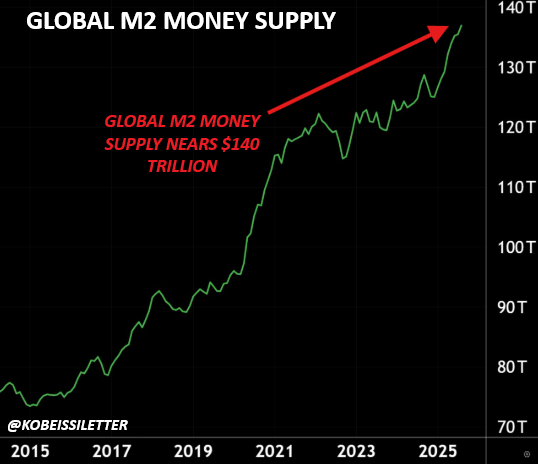
Lastly, global M2 money supply is about to hit $140 trillion for the first time in history.
In just 6 months, global M2 money supply has surged +$8 TRILLION.
Investors are losing confidence in fiat.
 Source
 Add to Favorites
 Download image
 Share x
 Copy link
Bitcoin may enter a prolonged sideways phase between $57K and $87K as markets enter a relief period following a 52% drop from ATH. This consolidation could mirror the 2022 fractal, creating liquidity before a potential breakdown toward the $44K–$50K range.
Doctor Profit/2026.03.09

Davinci Jeremie urged people to buy $1 of Bitcoin in 2013 and became a symbol of early conviction. Years later, fame, lifestyle flexing, and token promotions sparked criticism. His journey reflects both crypto foresight and influencer-era controversy.
StarPlatinum/2026.03.04
A sweeping narrative ties Jane Street to India’s expiry-day options case, alleged 10AM Bitcoin sell patterns, Terra’s collapse, and ETF plumbing. While none prove misconduct, critics argue a common structure: move spot, monetize derivatives, keep execution opaque.
Bull Theory/2026.02.27
A controversial narrative links Jane Street, ETF mechanics, and Bitcoin’s price behavior, pointing to lawsuit allegations, 10AM volatility patterns, and derivative hedging dynamics. The discussion raises broader questions about liquidity, structure, and price discovery.
Justin Bechler/2026.02.26
A new federal lawsuit alleges Jane Street exploited non-public information tied to Terraform’s liquidity defenses, accelerating UST’s depeg and the Terra collapse. The firm denies the claims. The case may reignite debates on structure, design, and regulation.
Diana/2026.02.25
Mean reversion and on-chain models sit at levels historically linked to bottom formation after capitulation. Realized losses reached record USD values, while deviations from anchor models remain extreme. Price pain may be fading; patience remains key.
Checkmate/2026.02.25
Hot feeds
A trader profits $448K by monitoring #Binance's new listings!
2024.12.13 17:37:29
Last week, funds have flowed into #Bitcoin, #Ethereum, and #Hyperliquid.
2024.12.16 14:48:36
A $PEPE whale that had been dormant for 600 days transferred all 2.1T $PEPE($52M) to a new address.
2024.12.14 10:35:27
When Elon Musk tweeted about Moltbook, the meme coin MOLT experienced a short-term 30% price surge, hitting a new all-time high of $114 million.
2026.01.31 18:37:29
A smart #AI coin trader made $17.6M on $GOAT, $ai16z, $Fartcoin,$arc.
2025.01.05 16:05:18
A sniper earned 2,277 $ETH ($8.3M) trading $SHIRO within 18 hours!
2024.12.03 23:09:08
MoreHot Articles
How did I turn $1,000 into $30,000 with smart money?
2024.12.09
10 promising AI Agent cryptos
2024.12.05
The 30-Year-Old Entrepreneur Behind Virtual, a Multi-Million Dollar AI Agent Society
2025.01.22
10 smart traders specializing in MEMEcoin trading on Solana
2024.12.09
A trader lost $73.9K trading memecoins in just 3 minutes — a lesson for us all!
2024.12.13
What is $SPORE? Let us take you through the on-chain records to show you how it works.
2024.12.25

